
Years of prioritising a product-first approach mean that organisations have lost sight of what it’s like for customers to experience them. Their broader services ecosystem is reduced to disjointed journeys, patchwork systems, and siloed teams. Service Design addresses this by aligning people, processes, and technologies to create seamless experiences across every touchpoint.

We believe better services and experiences come from deeply understanding markets and people, fostering collaboration across teams, and using visual tools to streamline decision-making.
Service Design capabilities
How we approach Service Design


Discover and immerse
The first step is to understand the culture, structure, and goals of the organisation and its services. Once aligned, we can collect data on customer and consumer dynamics and their experiences.
- Vision statement
- Data and insights
- Stakeholder map

Define today
The second step is about bringing the collected data to life. We do this by reflecting on and determining how the services work today, mapping out all front-stage and back-stage people, processes, and technologies.
- Customer profiles
- Journey maps
- Service blueprints

Develop tomorrow
Once we understand the service ecosystem, we can find opportunities for improving it. Once we have a strategy for change, we plan how to deliver it.
- Updated maps/blueprints
- Storyboards and prototypes
- Roadmaps
- Change management plan

Deliver change
This last step involves implementing and reviewing change within the organisation. From procedures and processes to touchpoints and technology, various degrees of change are implemented and iteratively validated.
- People and culture
- Processes and procedures
- Touchpoints and technology

Service Design shouldn’t be considered a one-and-done project. It’s a movement within your organisation. It shapes your vision, navigates complexity, and makes new futures possible.
Service Design case studies
- 2,161 leads generated with £155 spend
- 24 participants recruited for the 90-day home study
- Delivered in 100 days
- 2,161 leads generated with £155 spend
- 24 participants recruited for the 90-day home study
- Delivered in 100 days
- 2,161 leads generated with £155 spend
- 24 participants recruited for the 90-day home study
- Delivered in 100 days
- 2,161 leads generated with £155 spend
- 24 participants recruited for the 90-day home study
- Delivered in 100 days
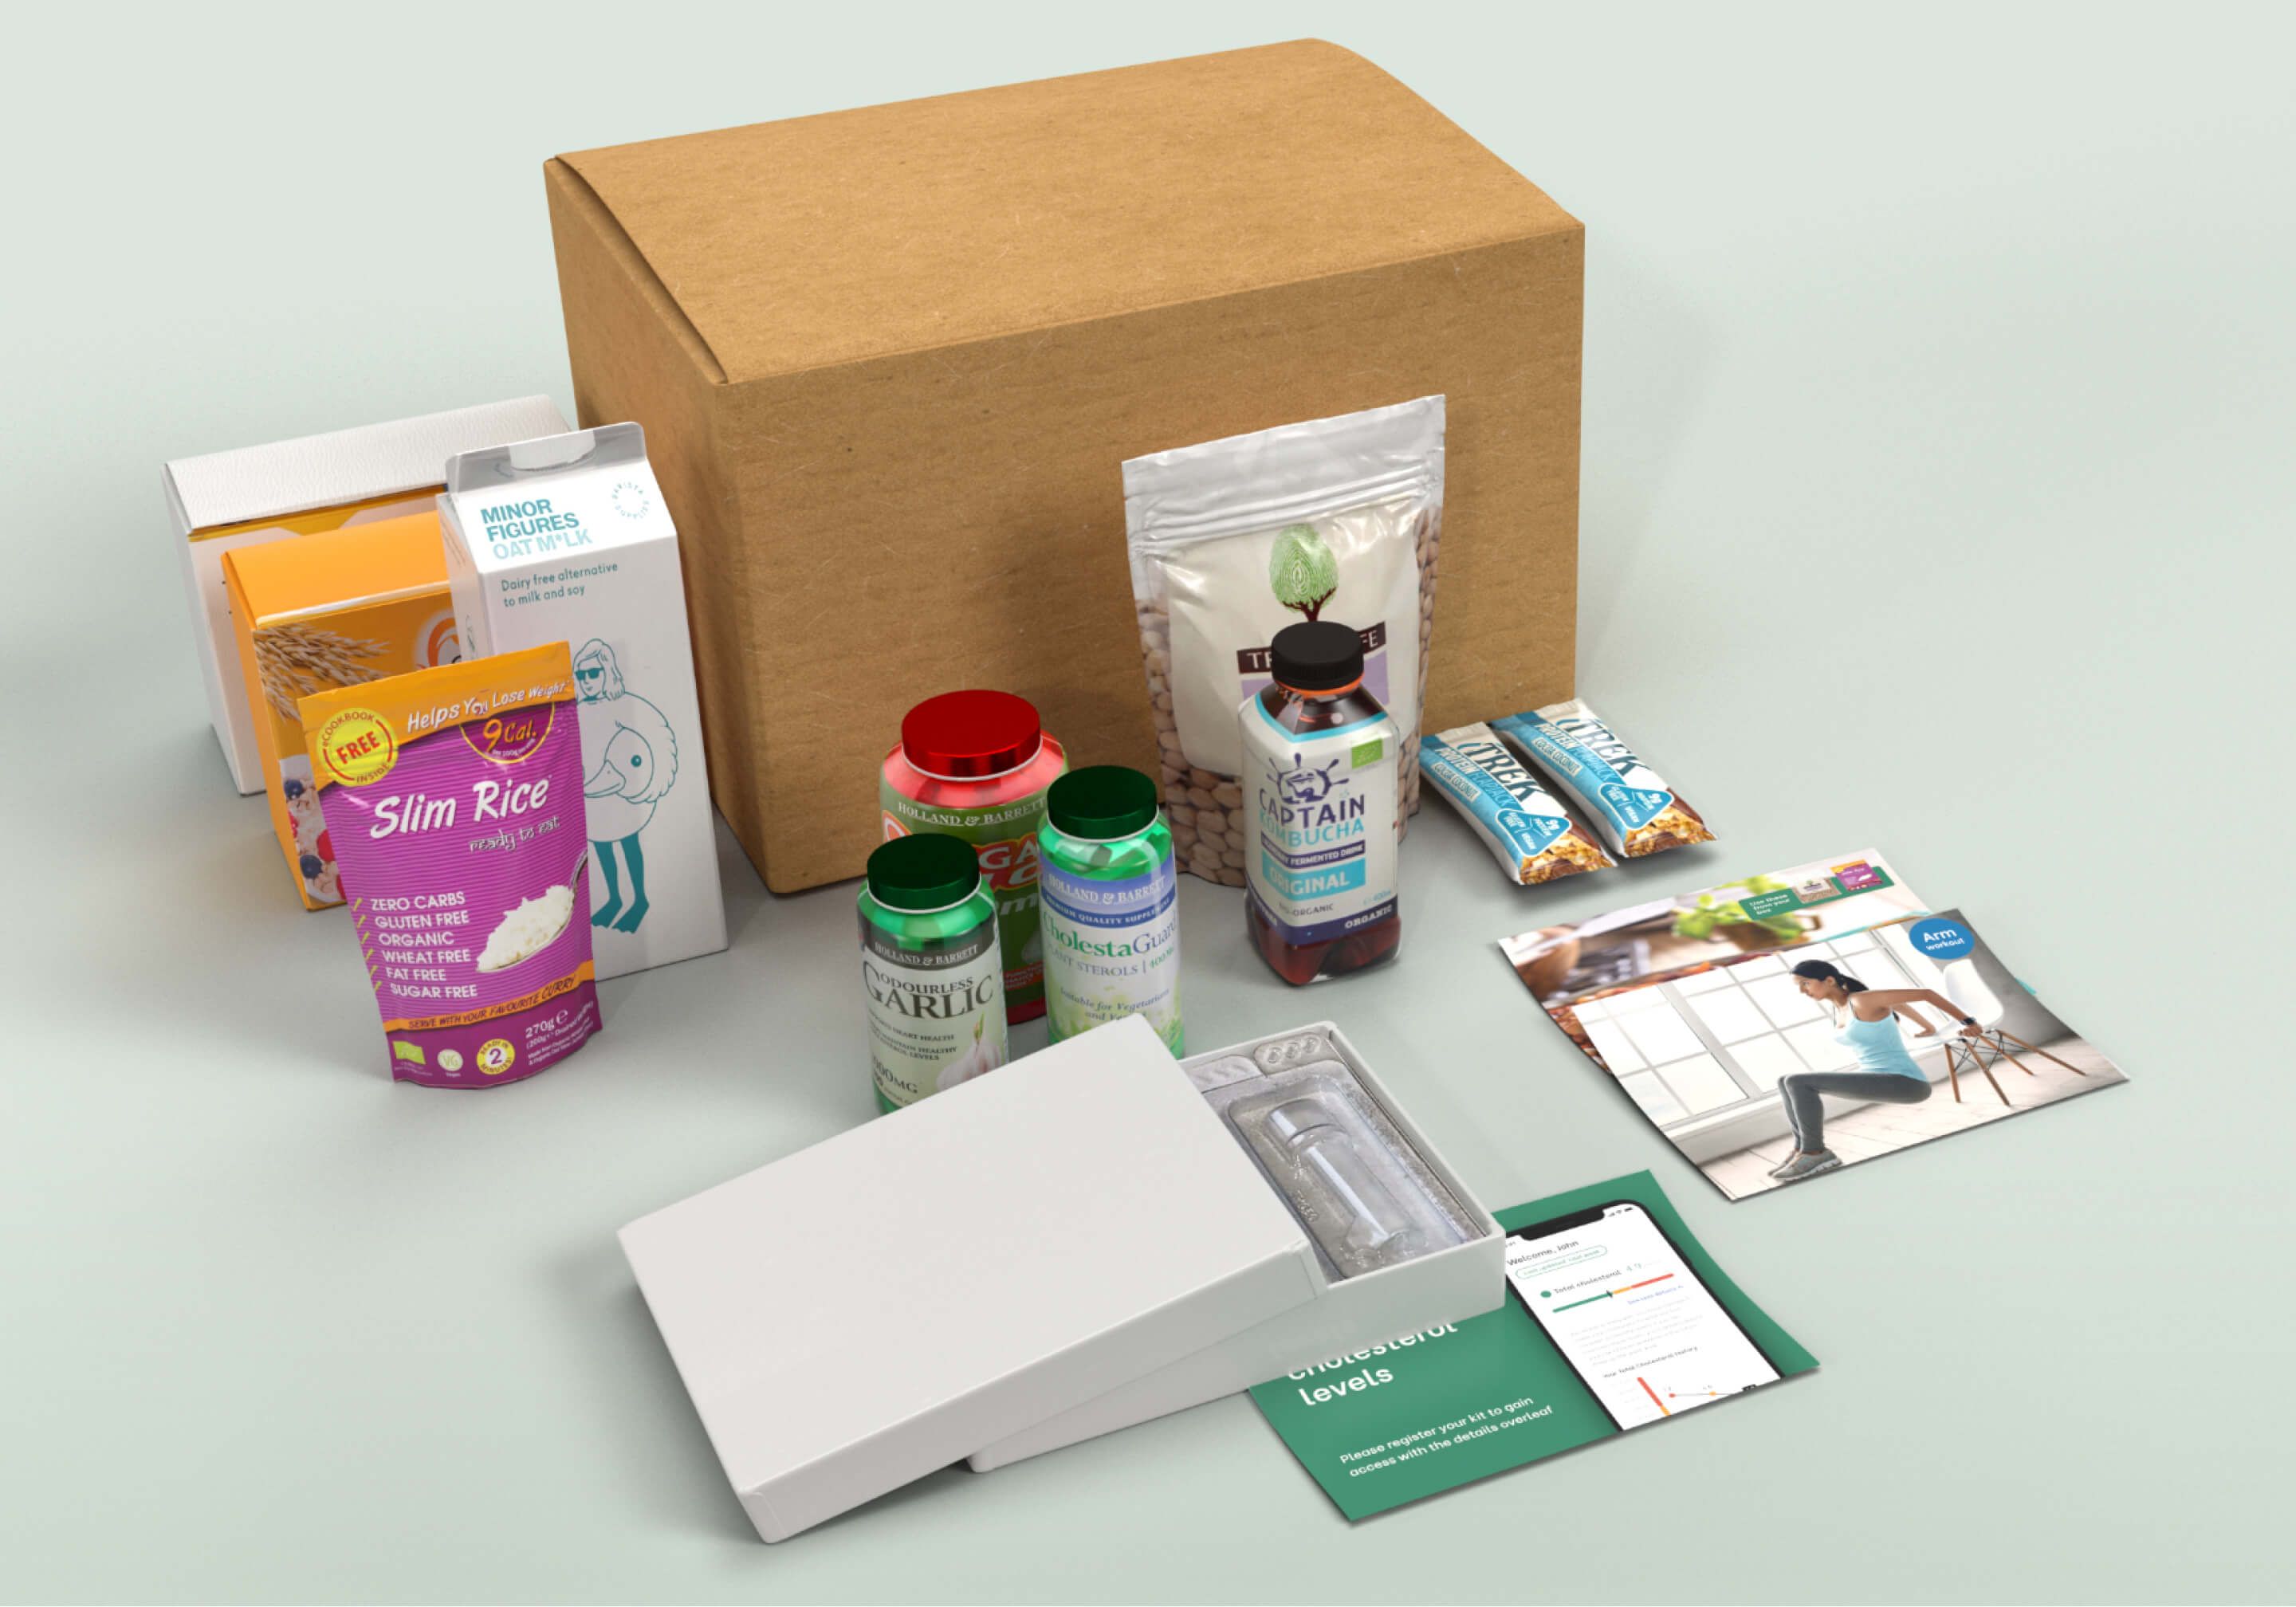
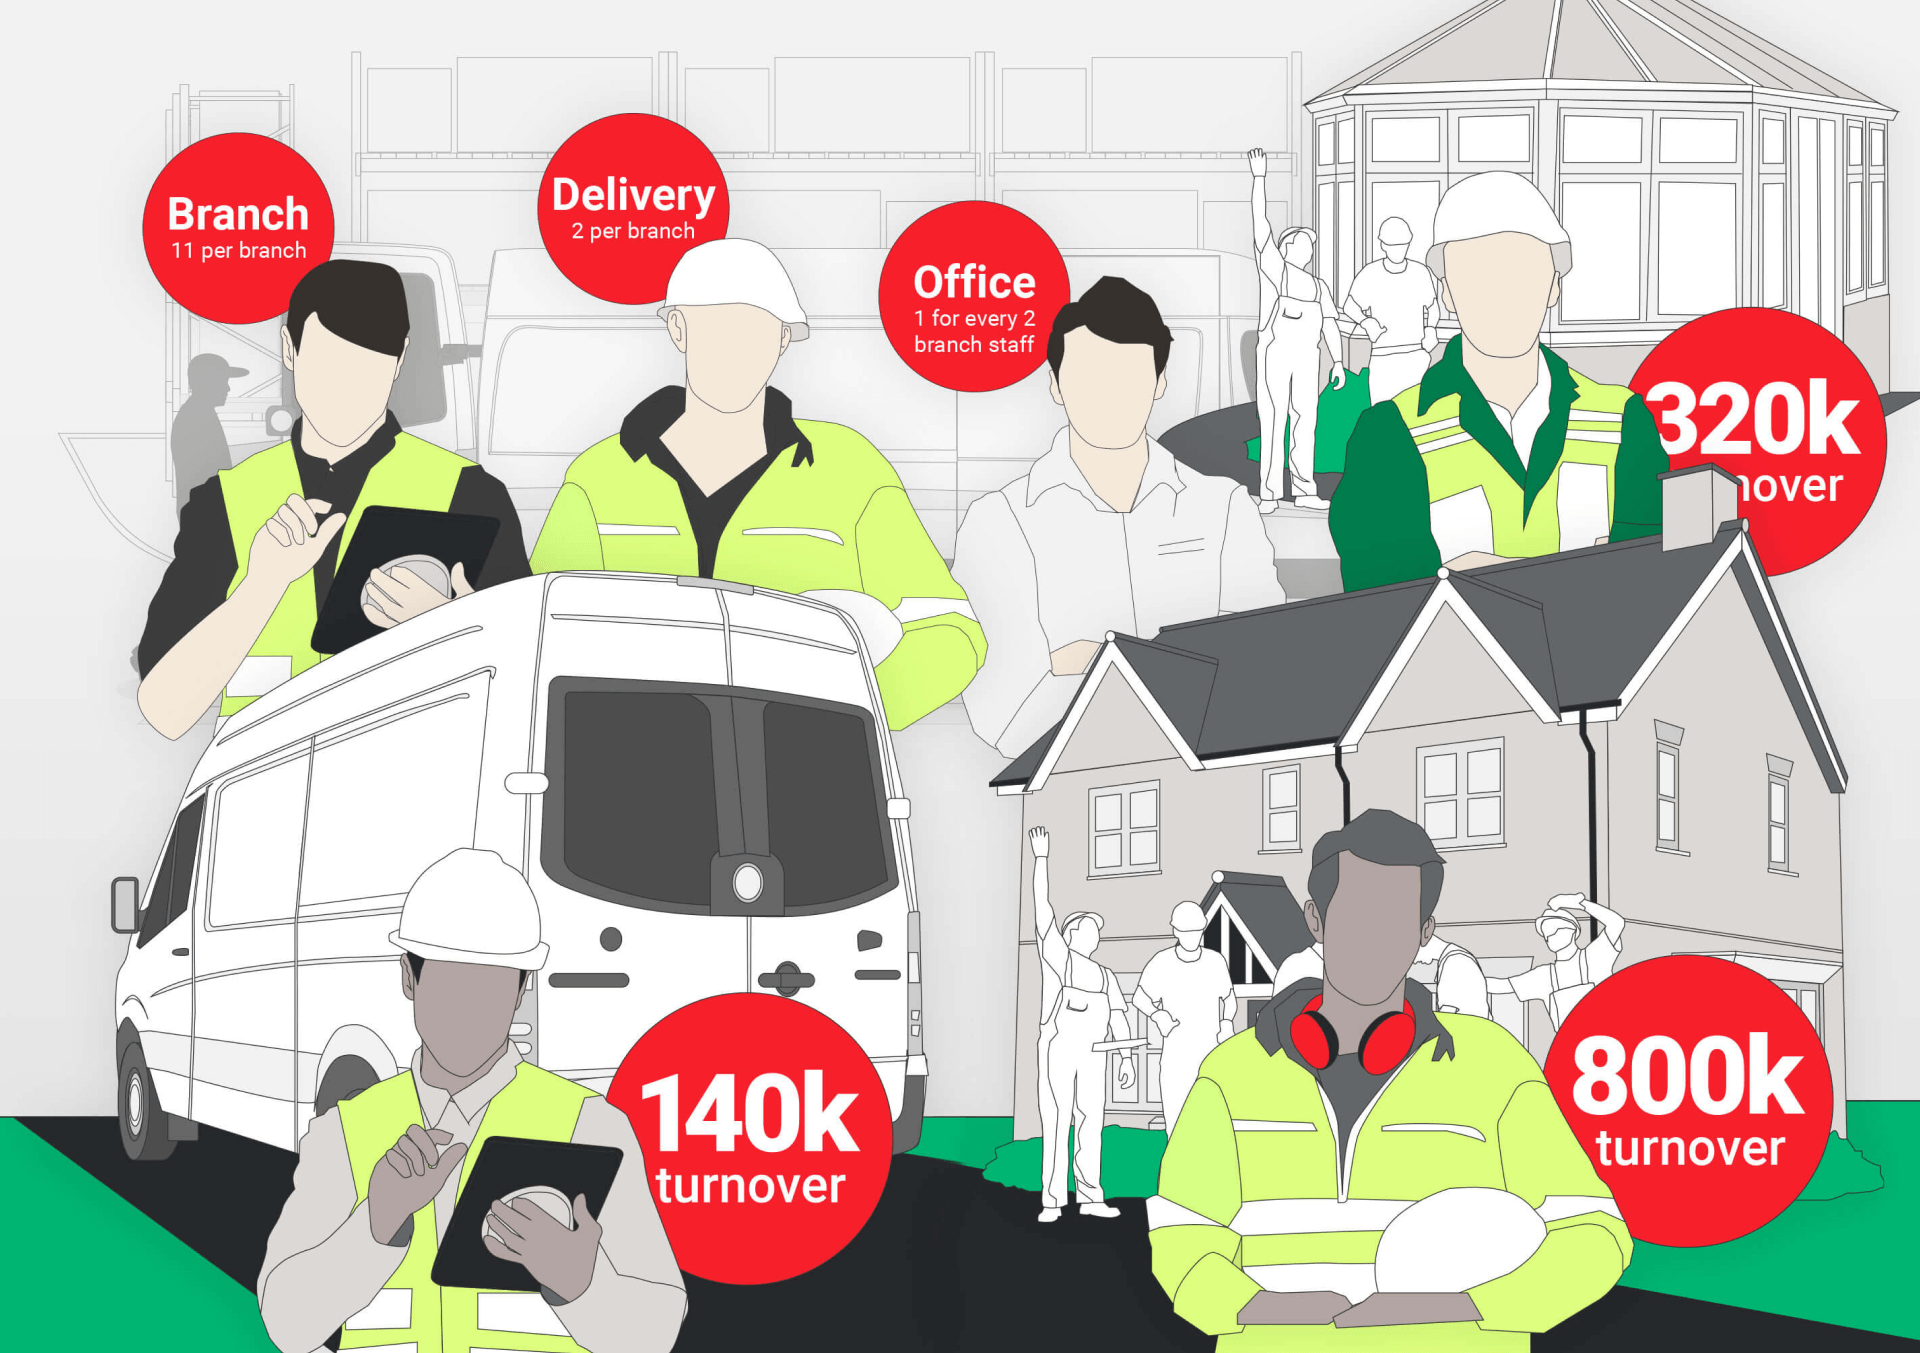
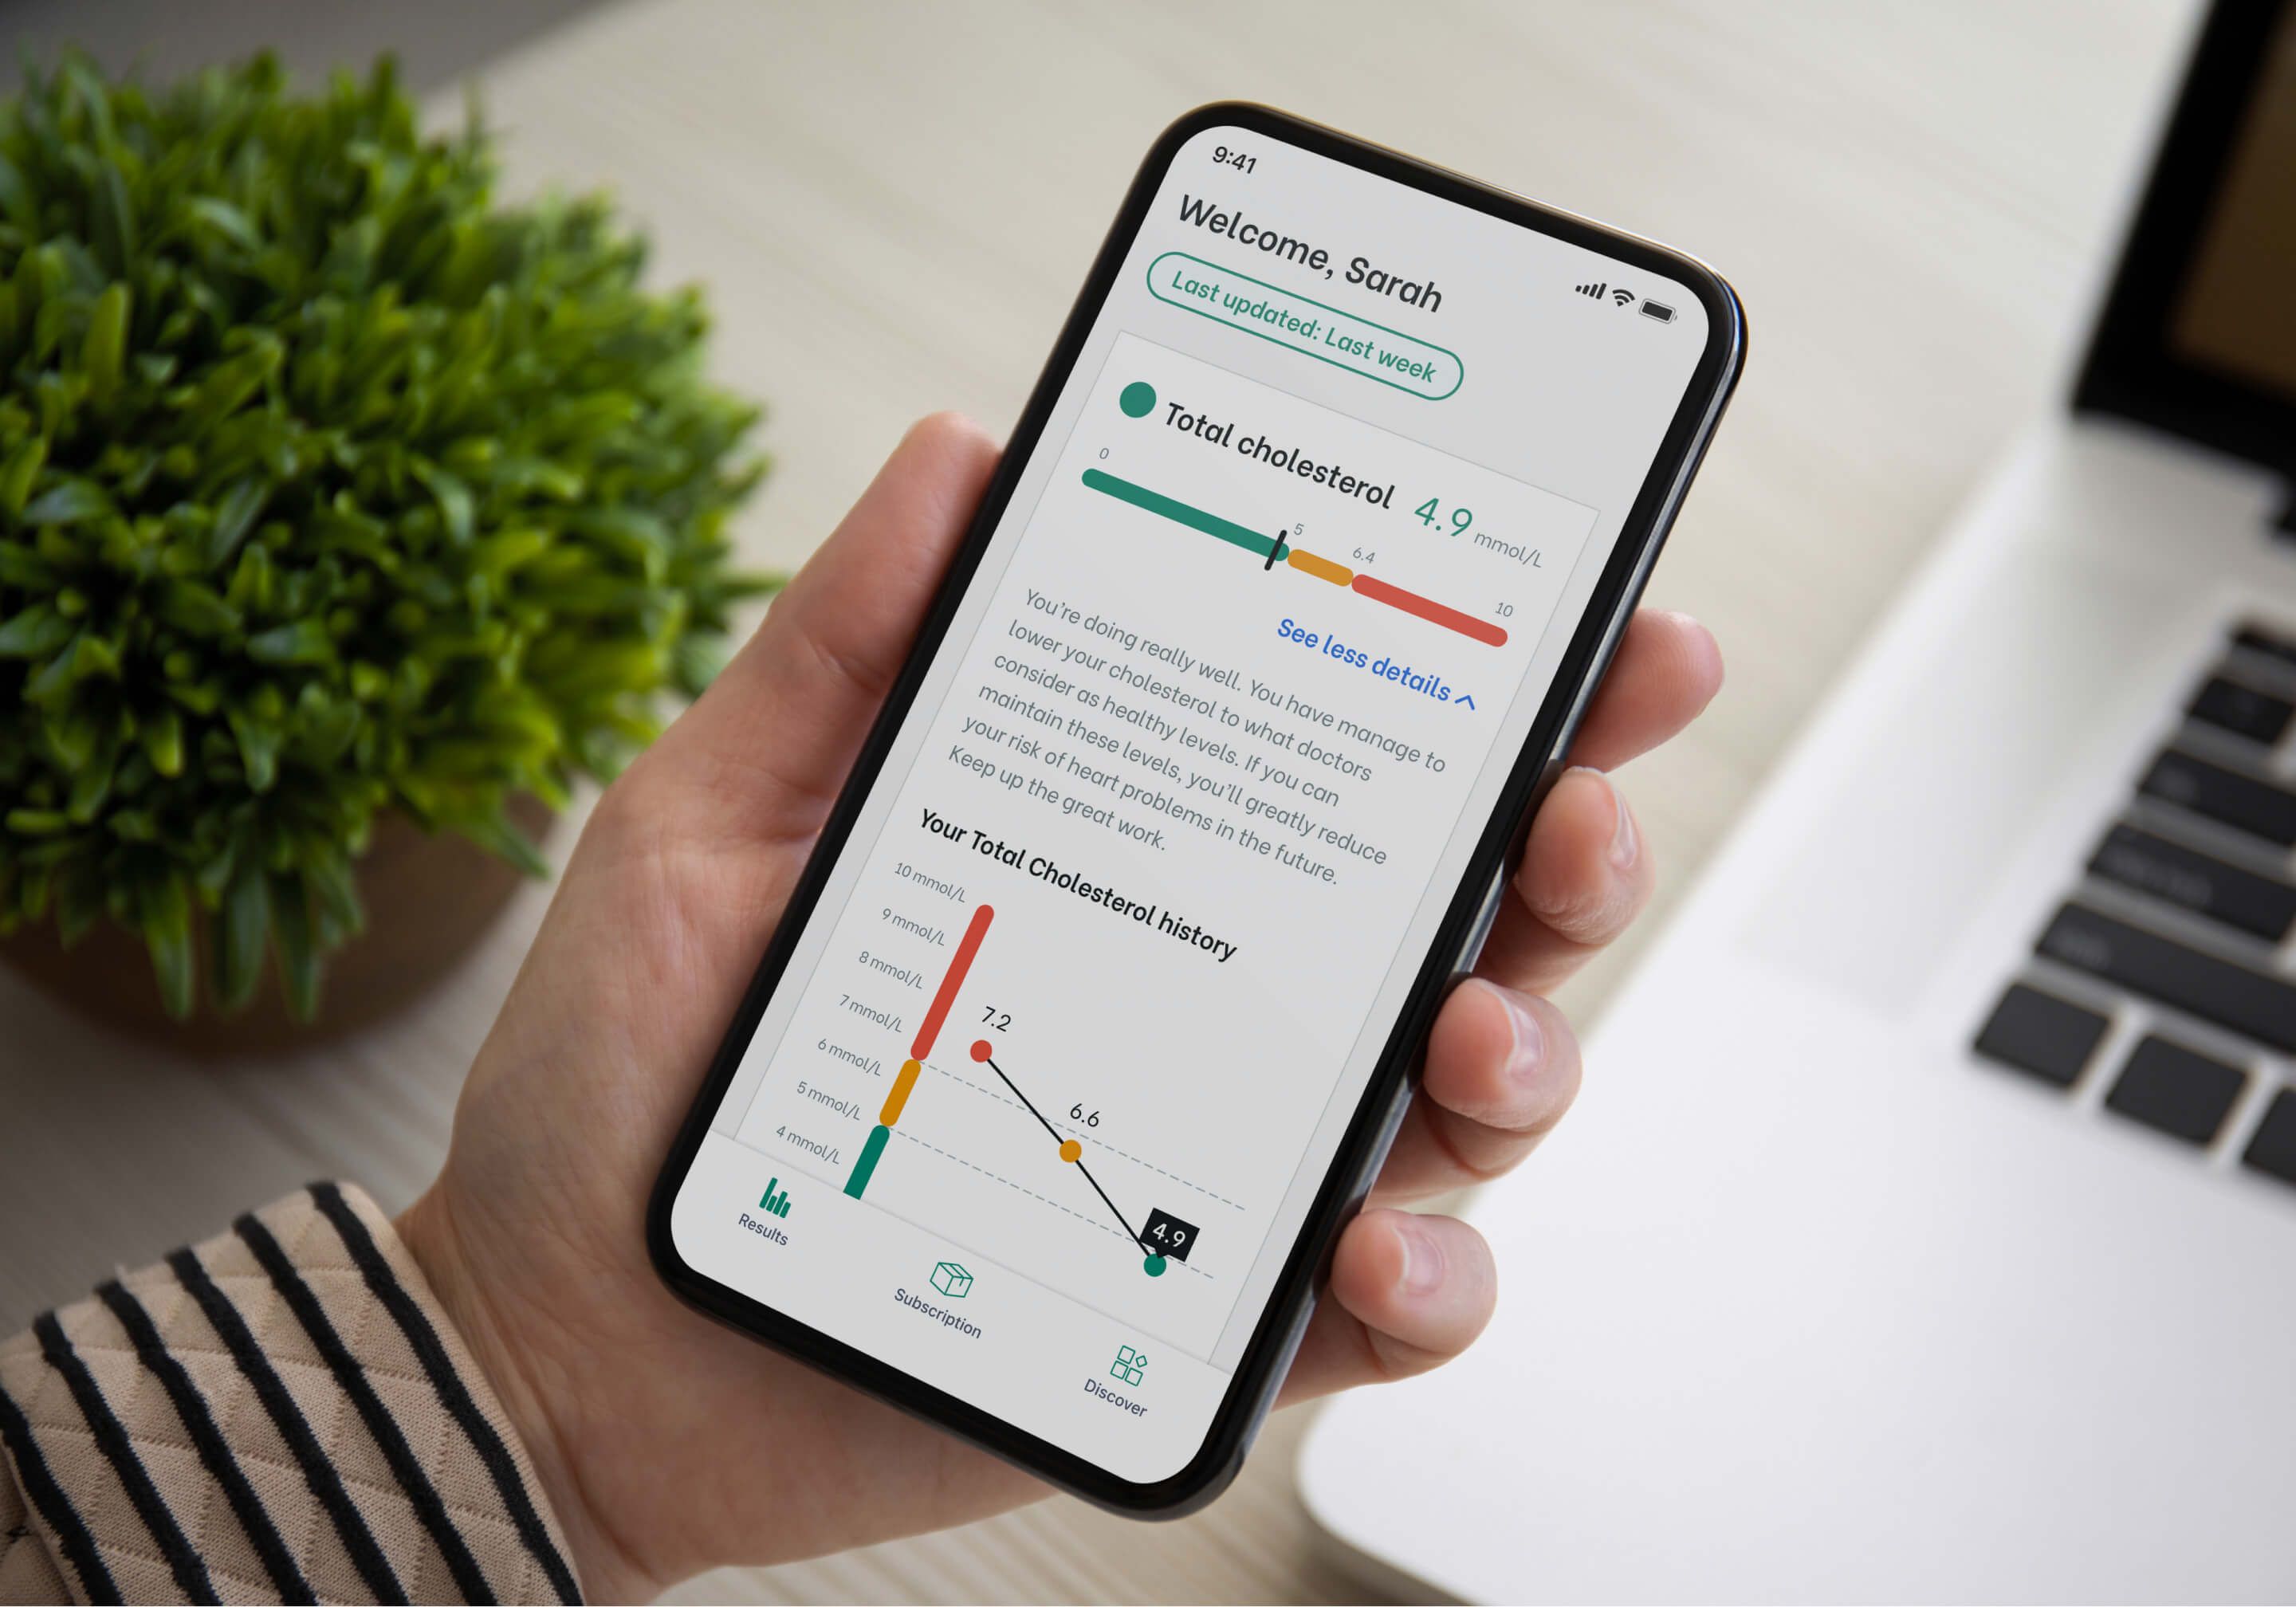
Holland & Barrett
90-day home study to validate a new market proposition
- 2.5 year relationship
- 3 core journeys
- 1000+ participants & customers contributing to testing
- 2.5 year relationship
- 3 core journeys
- 1000+ participants & customers contributing to testing
- 2.5 year relationship
- 3 core journeys
- 1000+ participants & customers contributing to testing
- 2.5 year relationship
- 3 core journeys
- 1000+ participants & customers contributing to testing
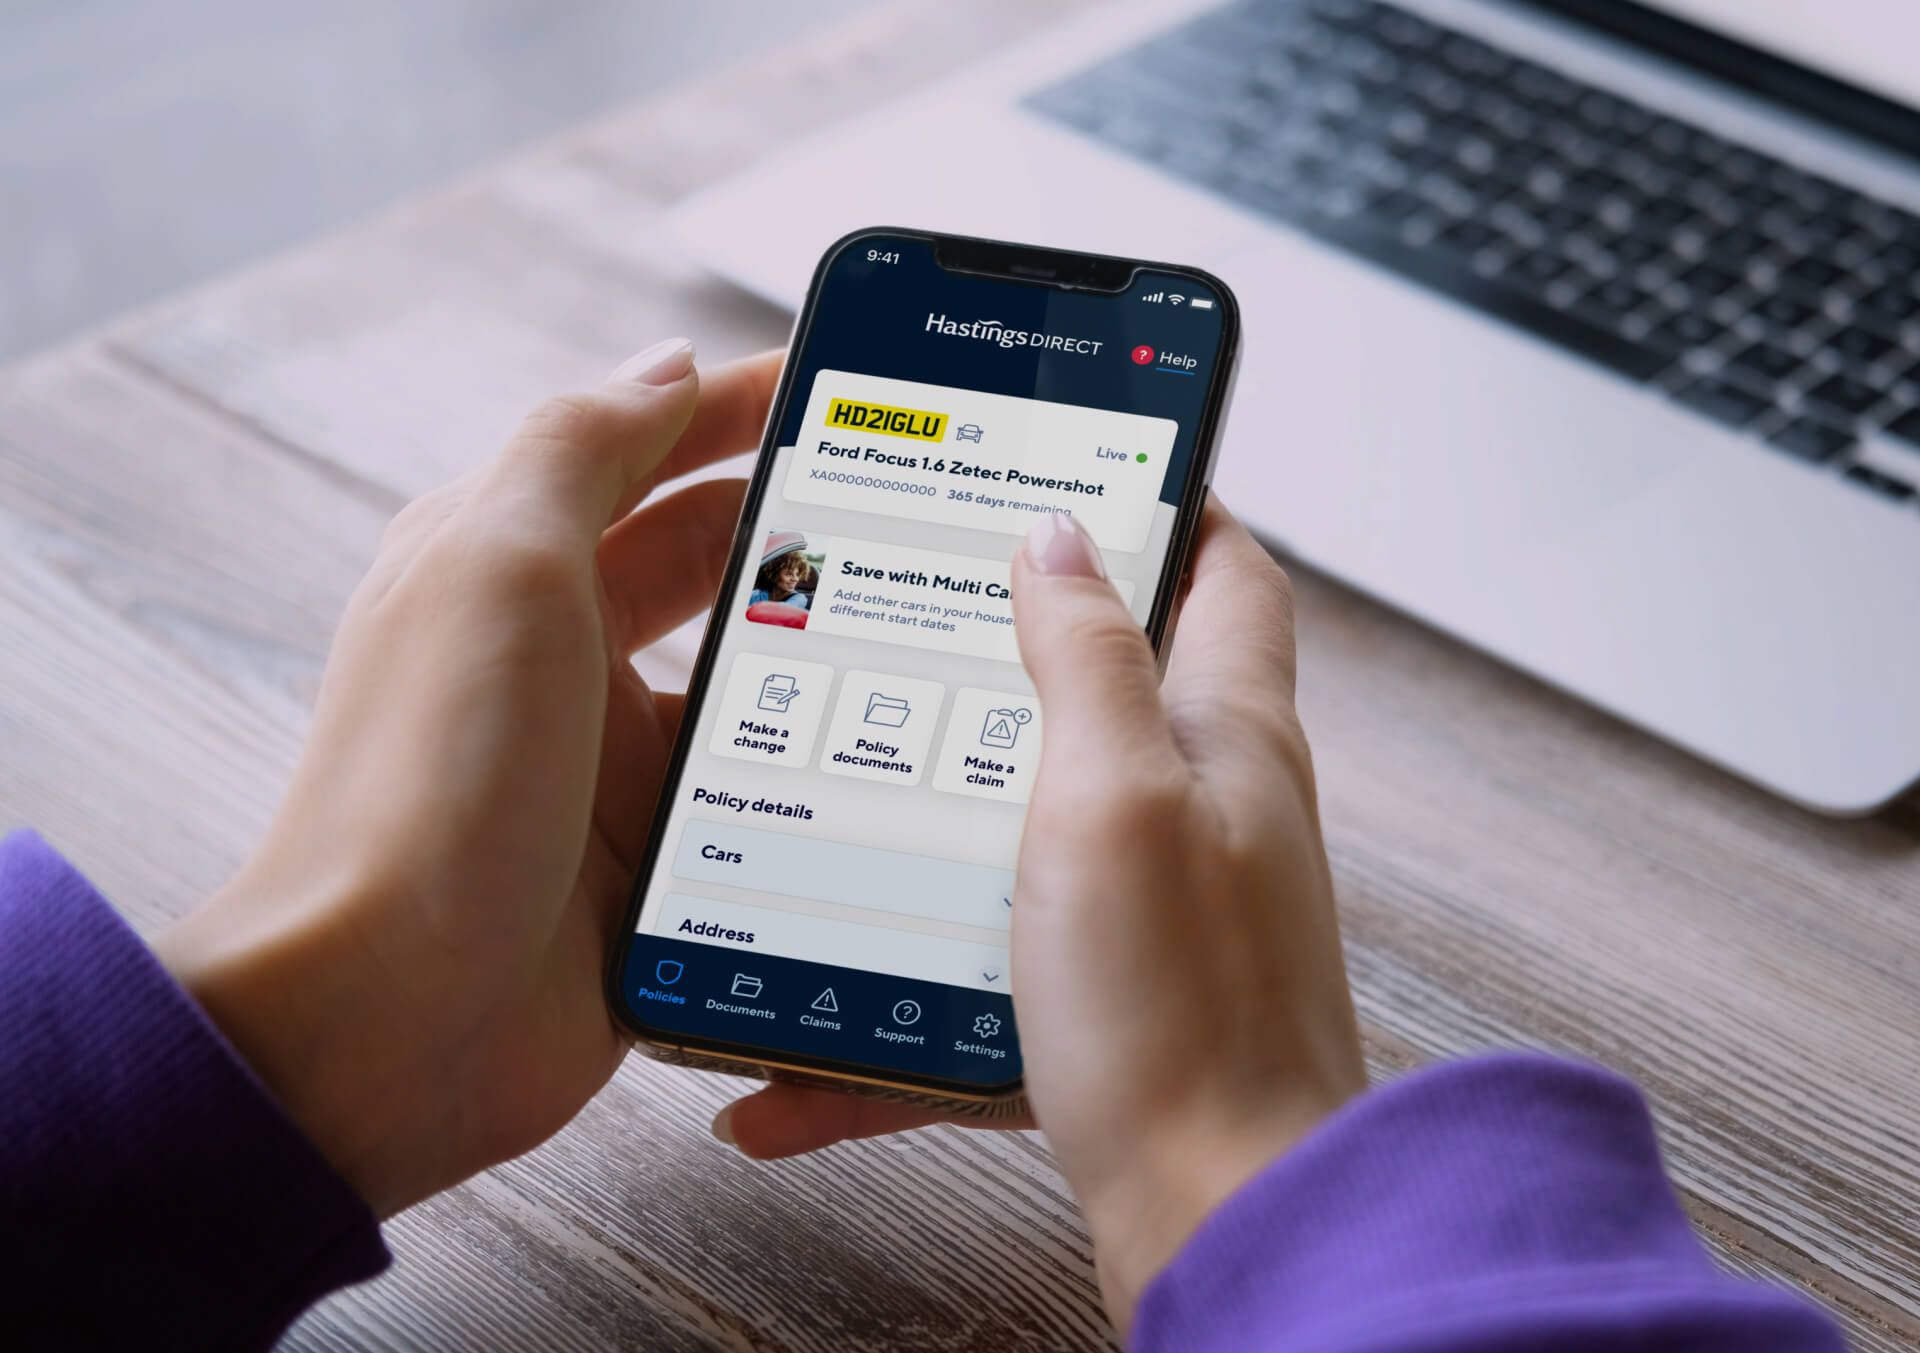
Hastings Direct
Digital transformation for the UK’s biggest digital insurer
- Growing worldwide market share by 27.3%
- Achieving user growth of 1.1m in 6-months
- 37 critical UX recommendations identified
- Growing worldwide market share by 27.3%
- Achieving user growth of 1.1m in 6-months
- 37 critical UX recommendations identified
- Growing worldwide market share by 27.3%
- Achieving user growth of 1.1m in 6-months
- 37 critical UX recommendations identified
- Growing worldwide market share by 27.3%
- Achieving user growth of 1.1m in 6-months
- 37 critical UX recommendations identified
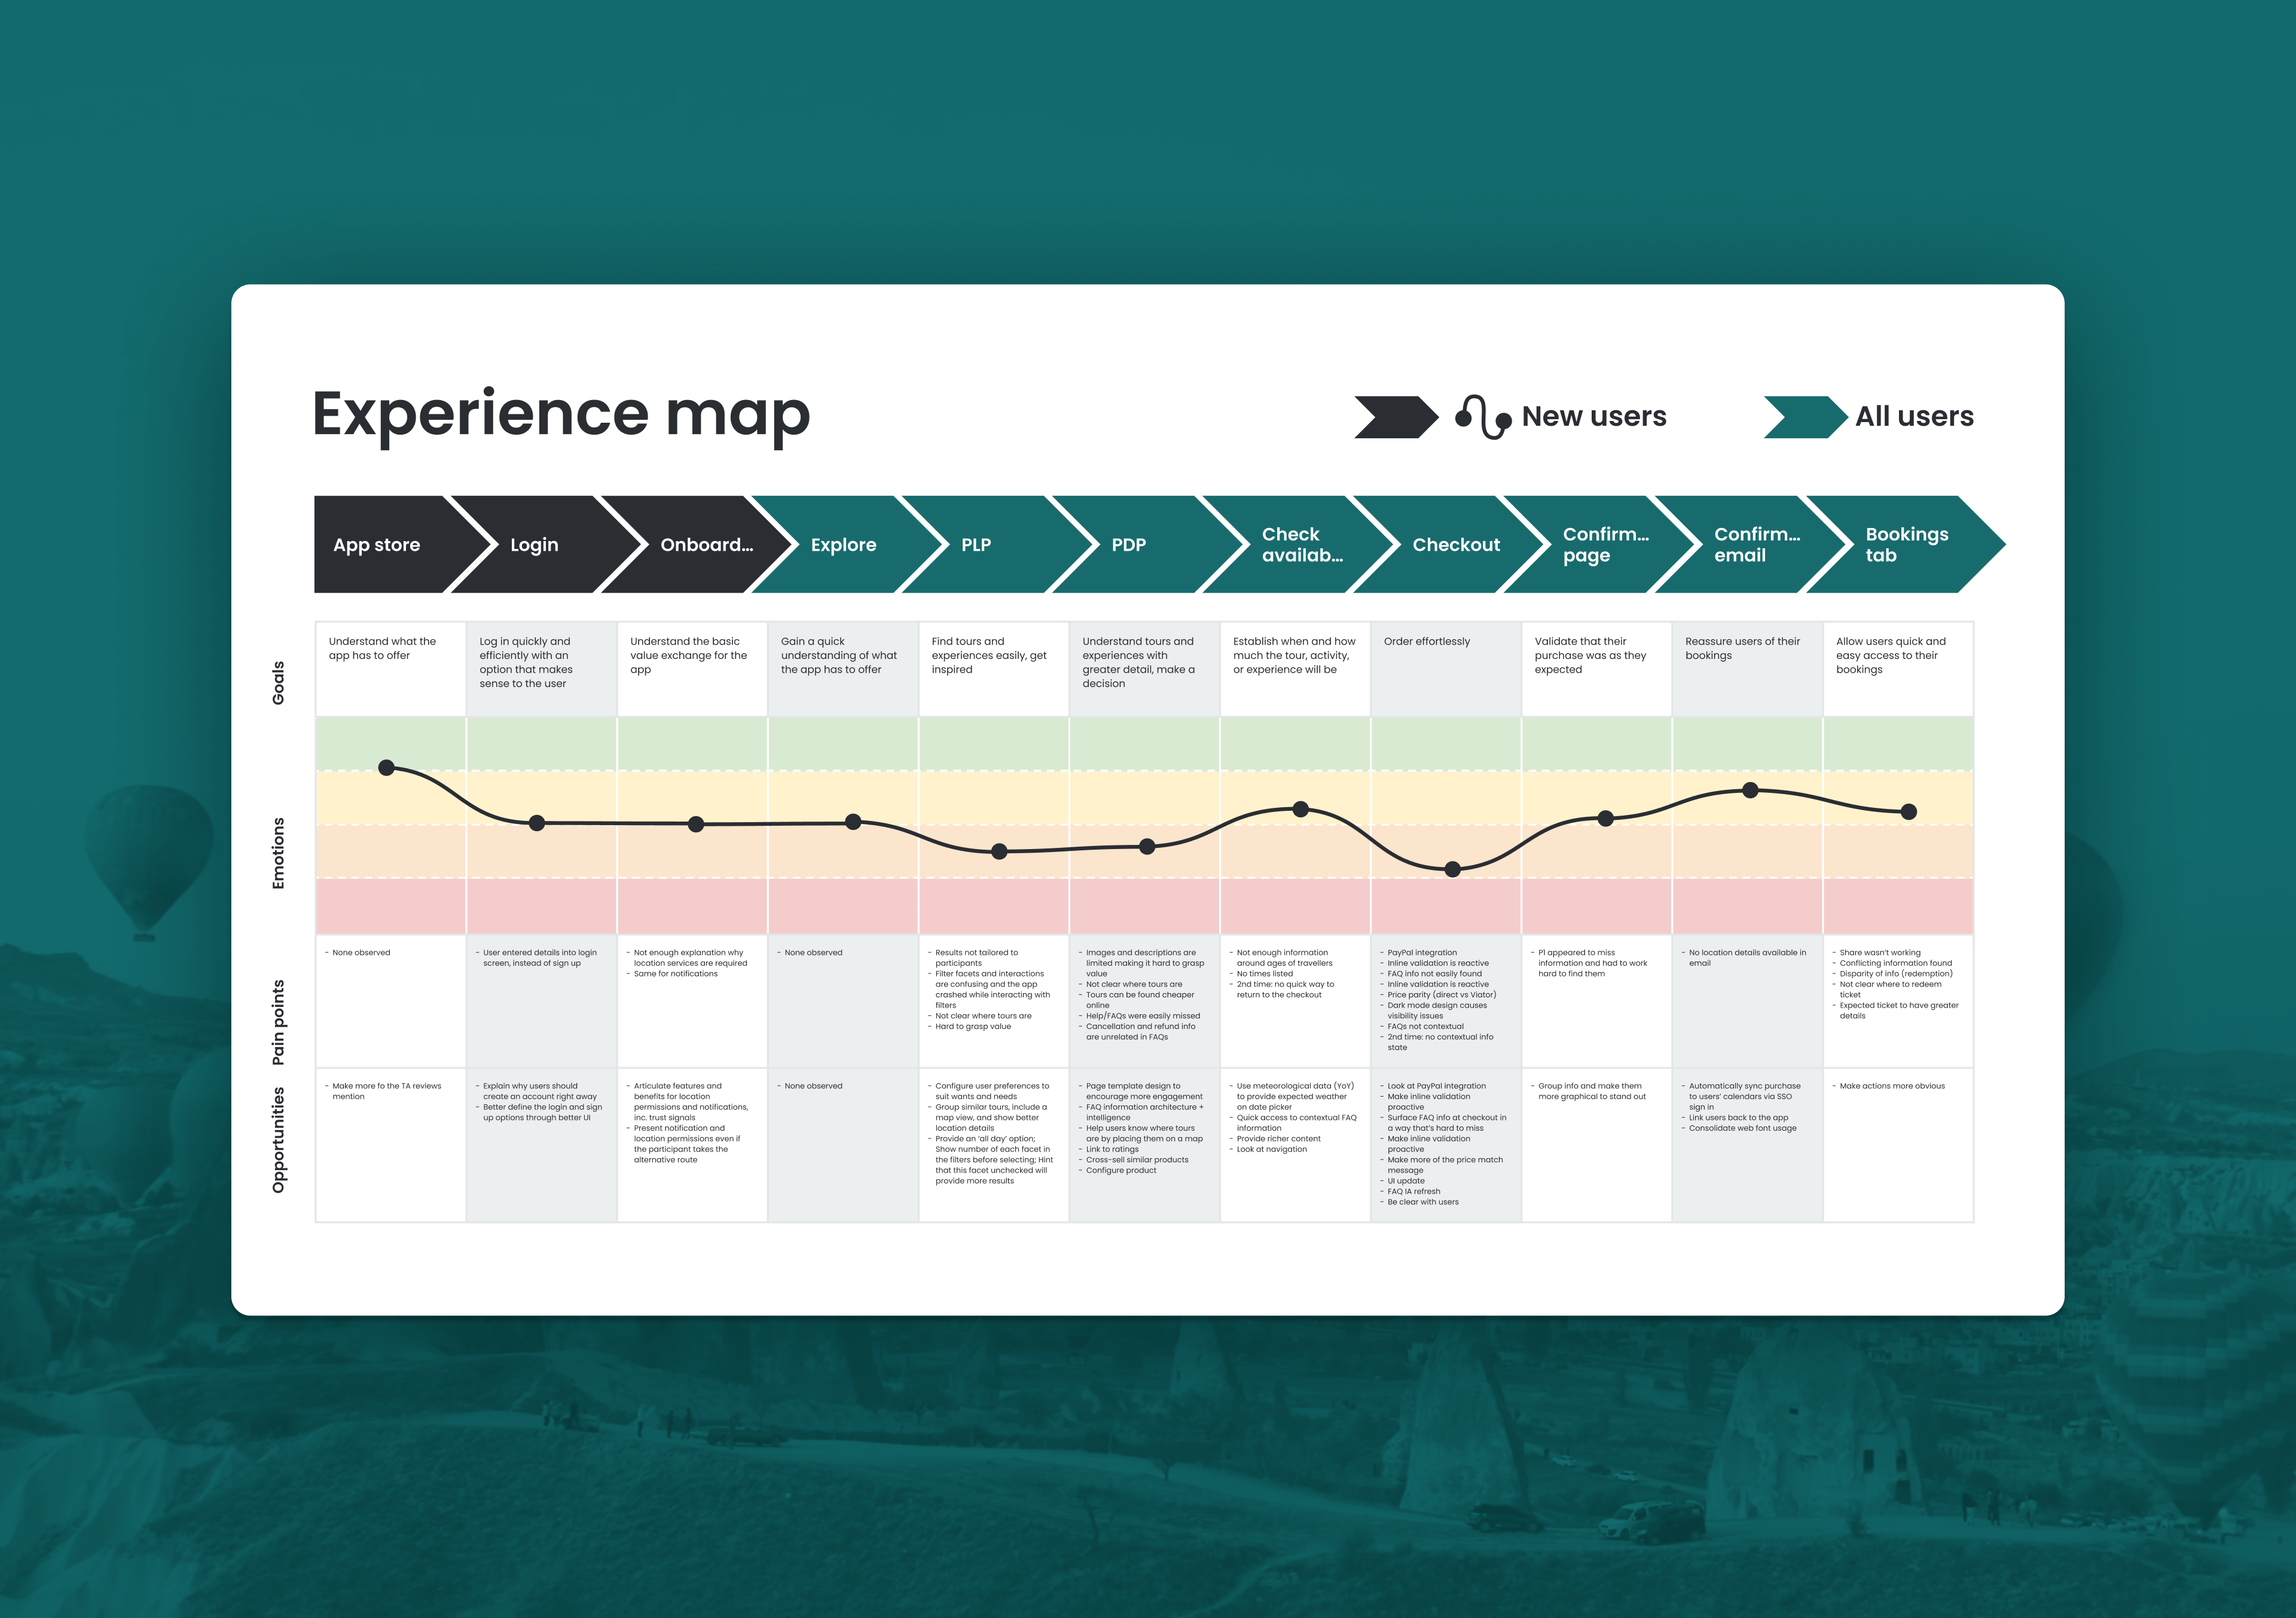
Viator
Research and validation for a leading travel app
- Validated with 4,499 travellers
- 7 critical categories for improvement
- Delivered over 3 sprints
- Validated with 4,499 travellers
- 7 critical categories for improvement
- Delivered over 3 sprints
- Validated with 4,499 travellers
- 7 critical categories for improvement
- Delivered over 3 sprints
- Validated with 4,499 travellers
- 7 critical categories for improvement
- Delivered over 3 sprints
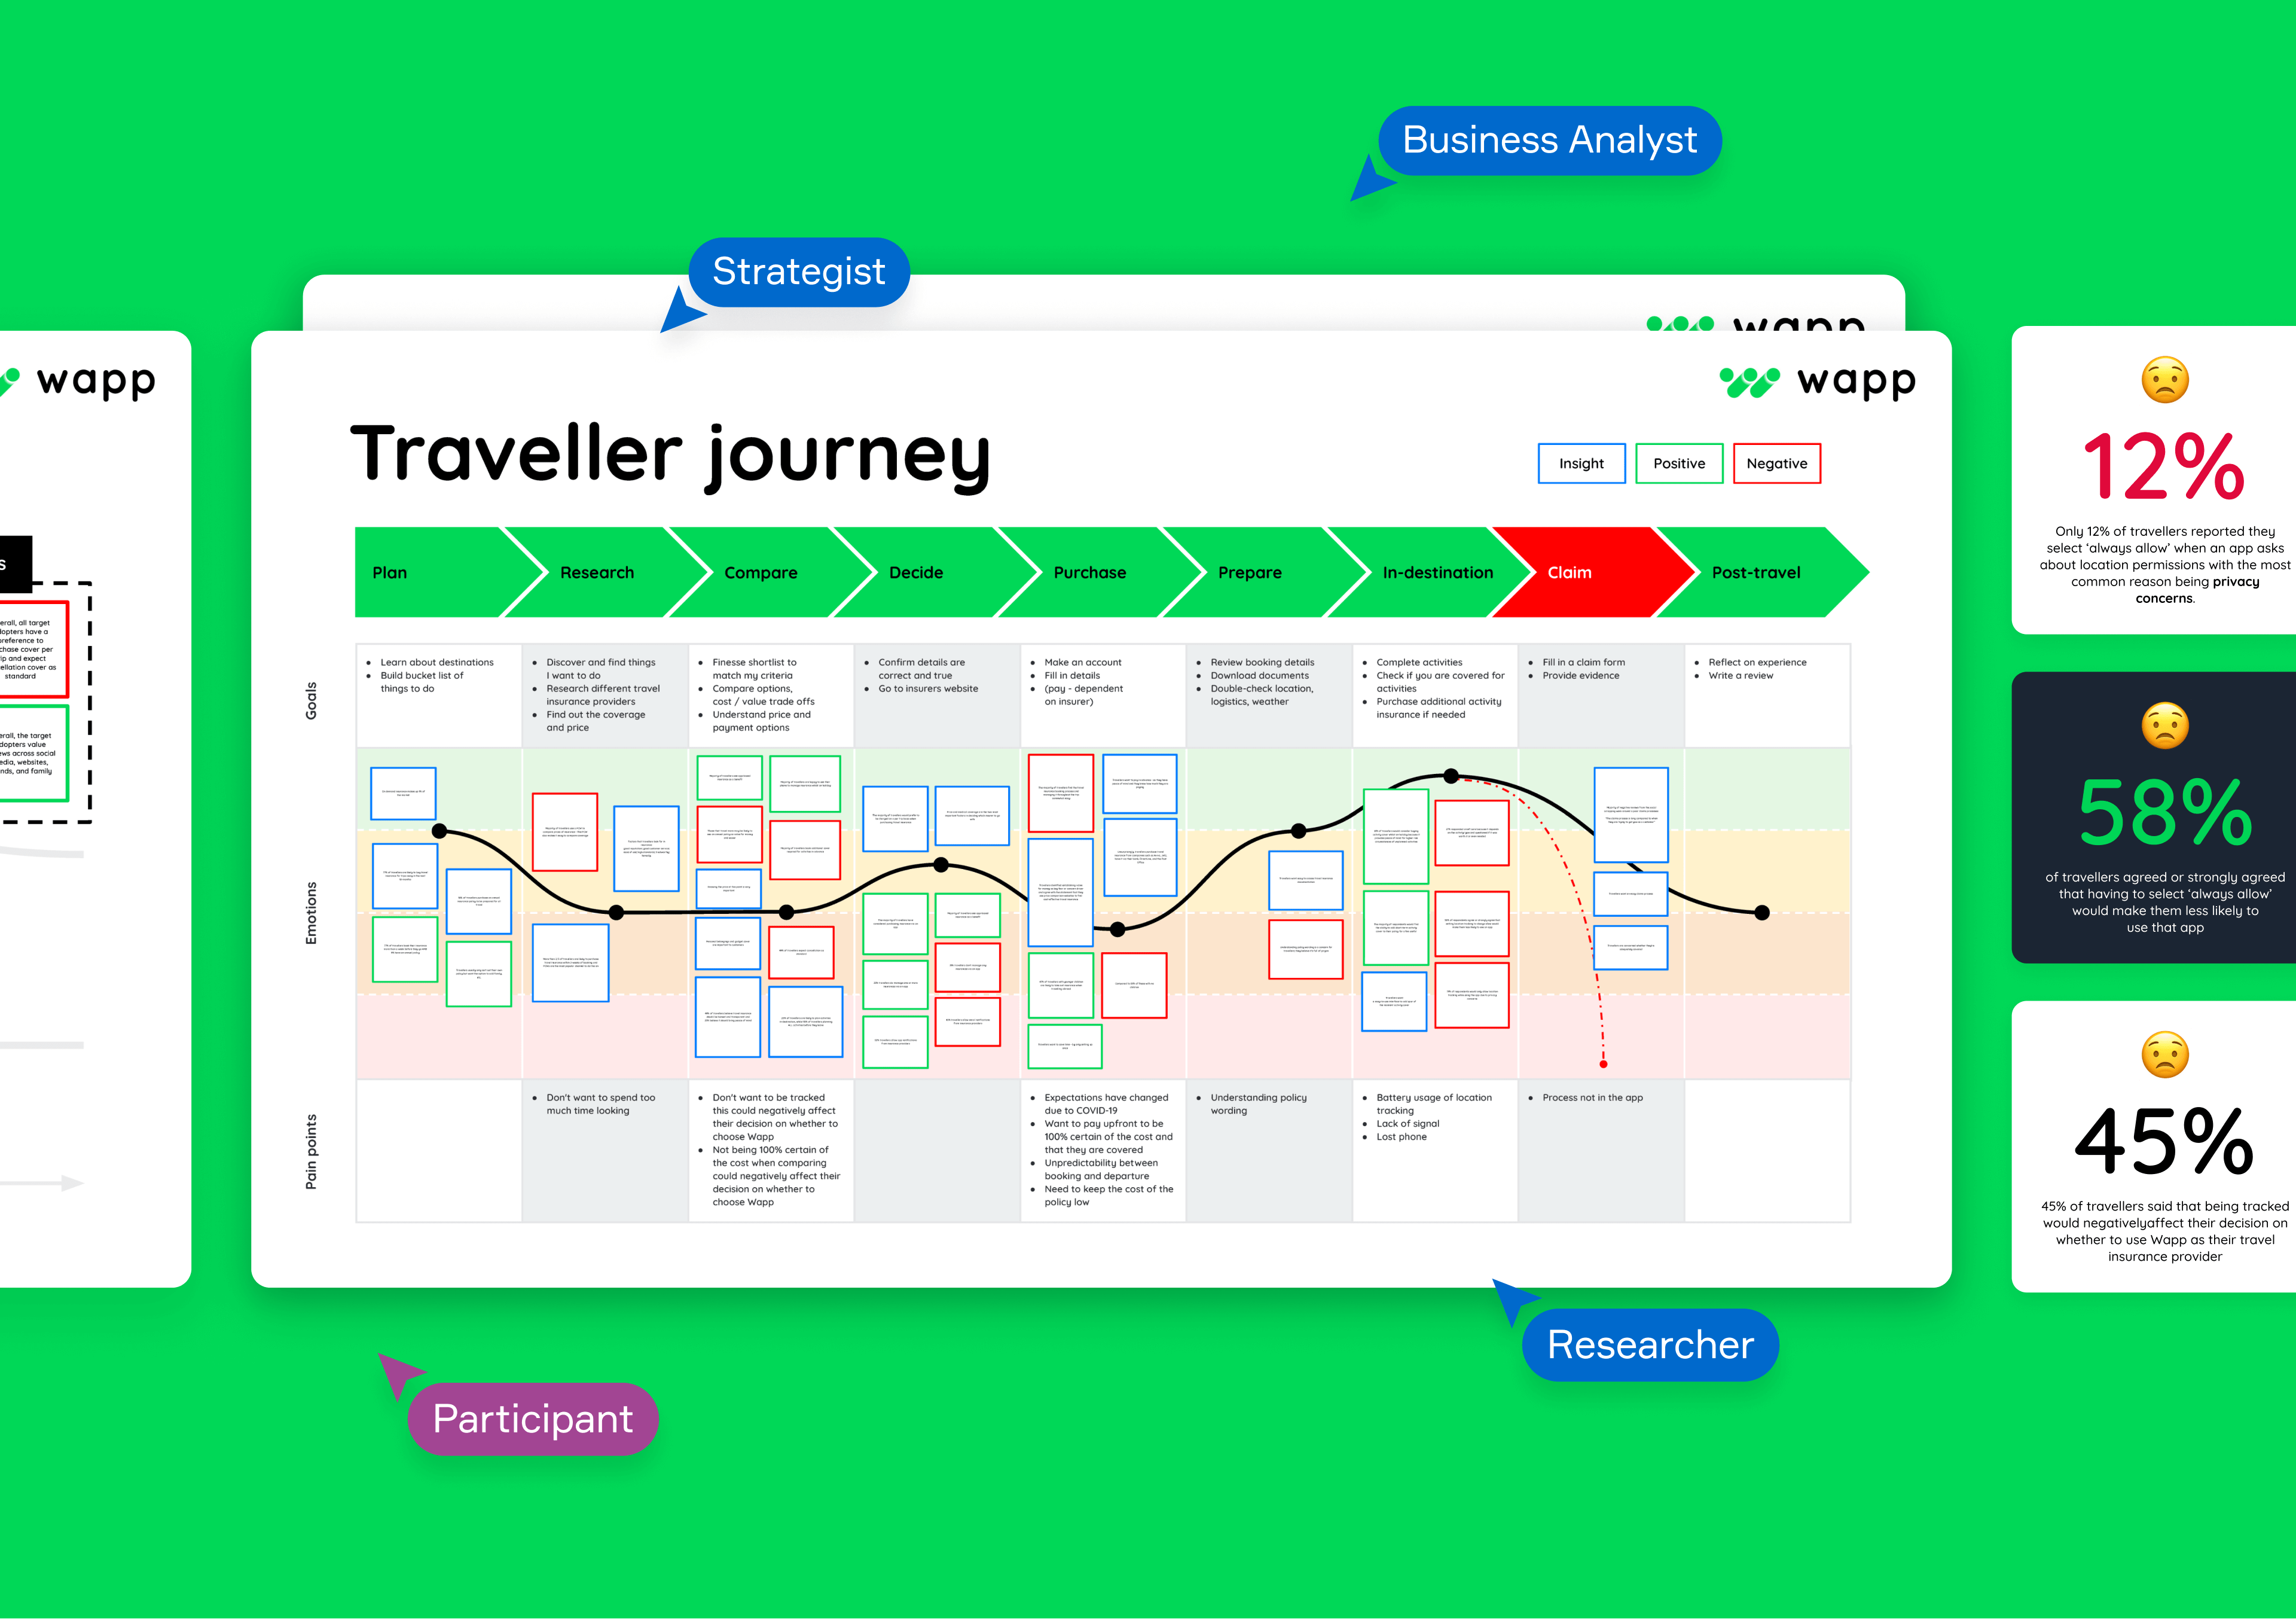
Wapp
Validating a new travel insurance proposition
- Validated with 947 participants
- 8 quantitative and qualitative methods
- 59 core journey changes recommended
- Validated with 947 participants
- 8 quantitative and qualitative methods
- 59 core journey changes recommended
- Validated with 947 participants
- 8 quantitative and qualitative methods
- 59 core journey changes recommended
- Validated with 947 participants
- 8 quantitative and qualitative methods
- 59 core journey changes recommended

Hastings Direct
Making a telephony proposition digital
- 2.3% in-store conversion rate increase
- 31 screens designed and delivered
- Delivered in 2 sprints
- 2.3% in-store conversion rate increase
- 31 screens designed and delivered
- Delivered in 2 sprints
- 2.3% in-store conversion rate increase
- 31 screens designed and delivered
- Delivered in 2 sprints
- 2.3% in-store conversion rate increase
- 31 screens designed and delivered
- Delivered in 2 sprints
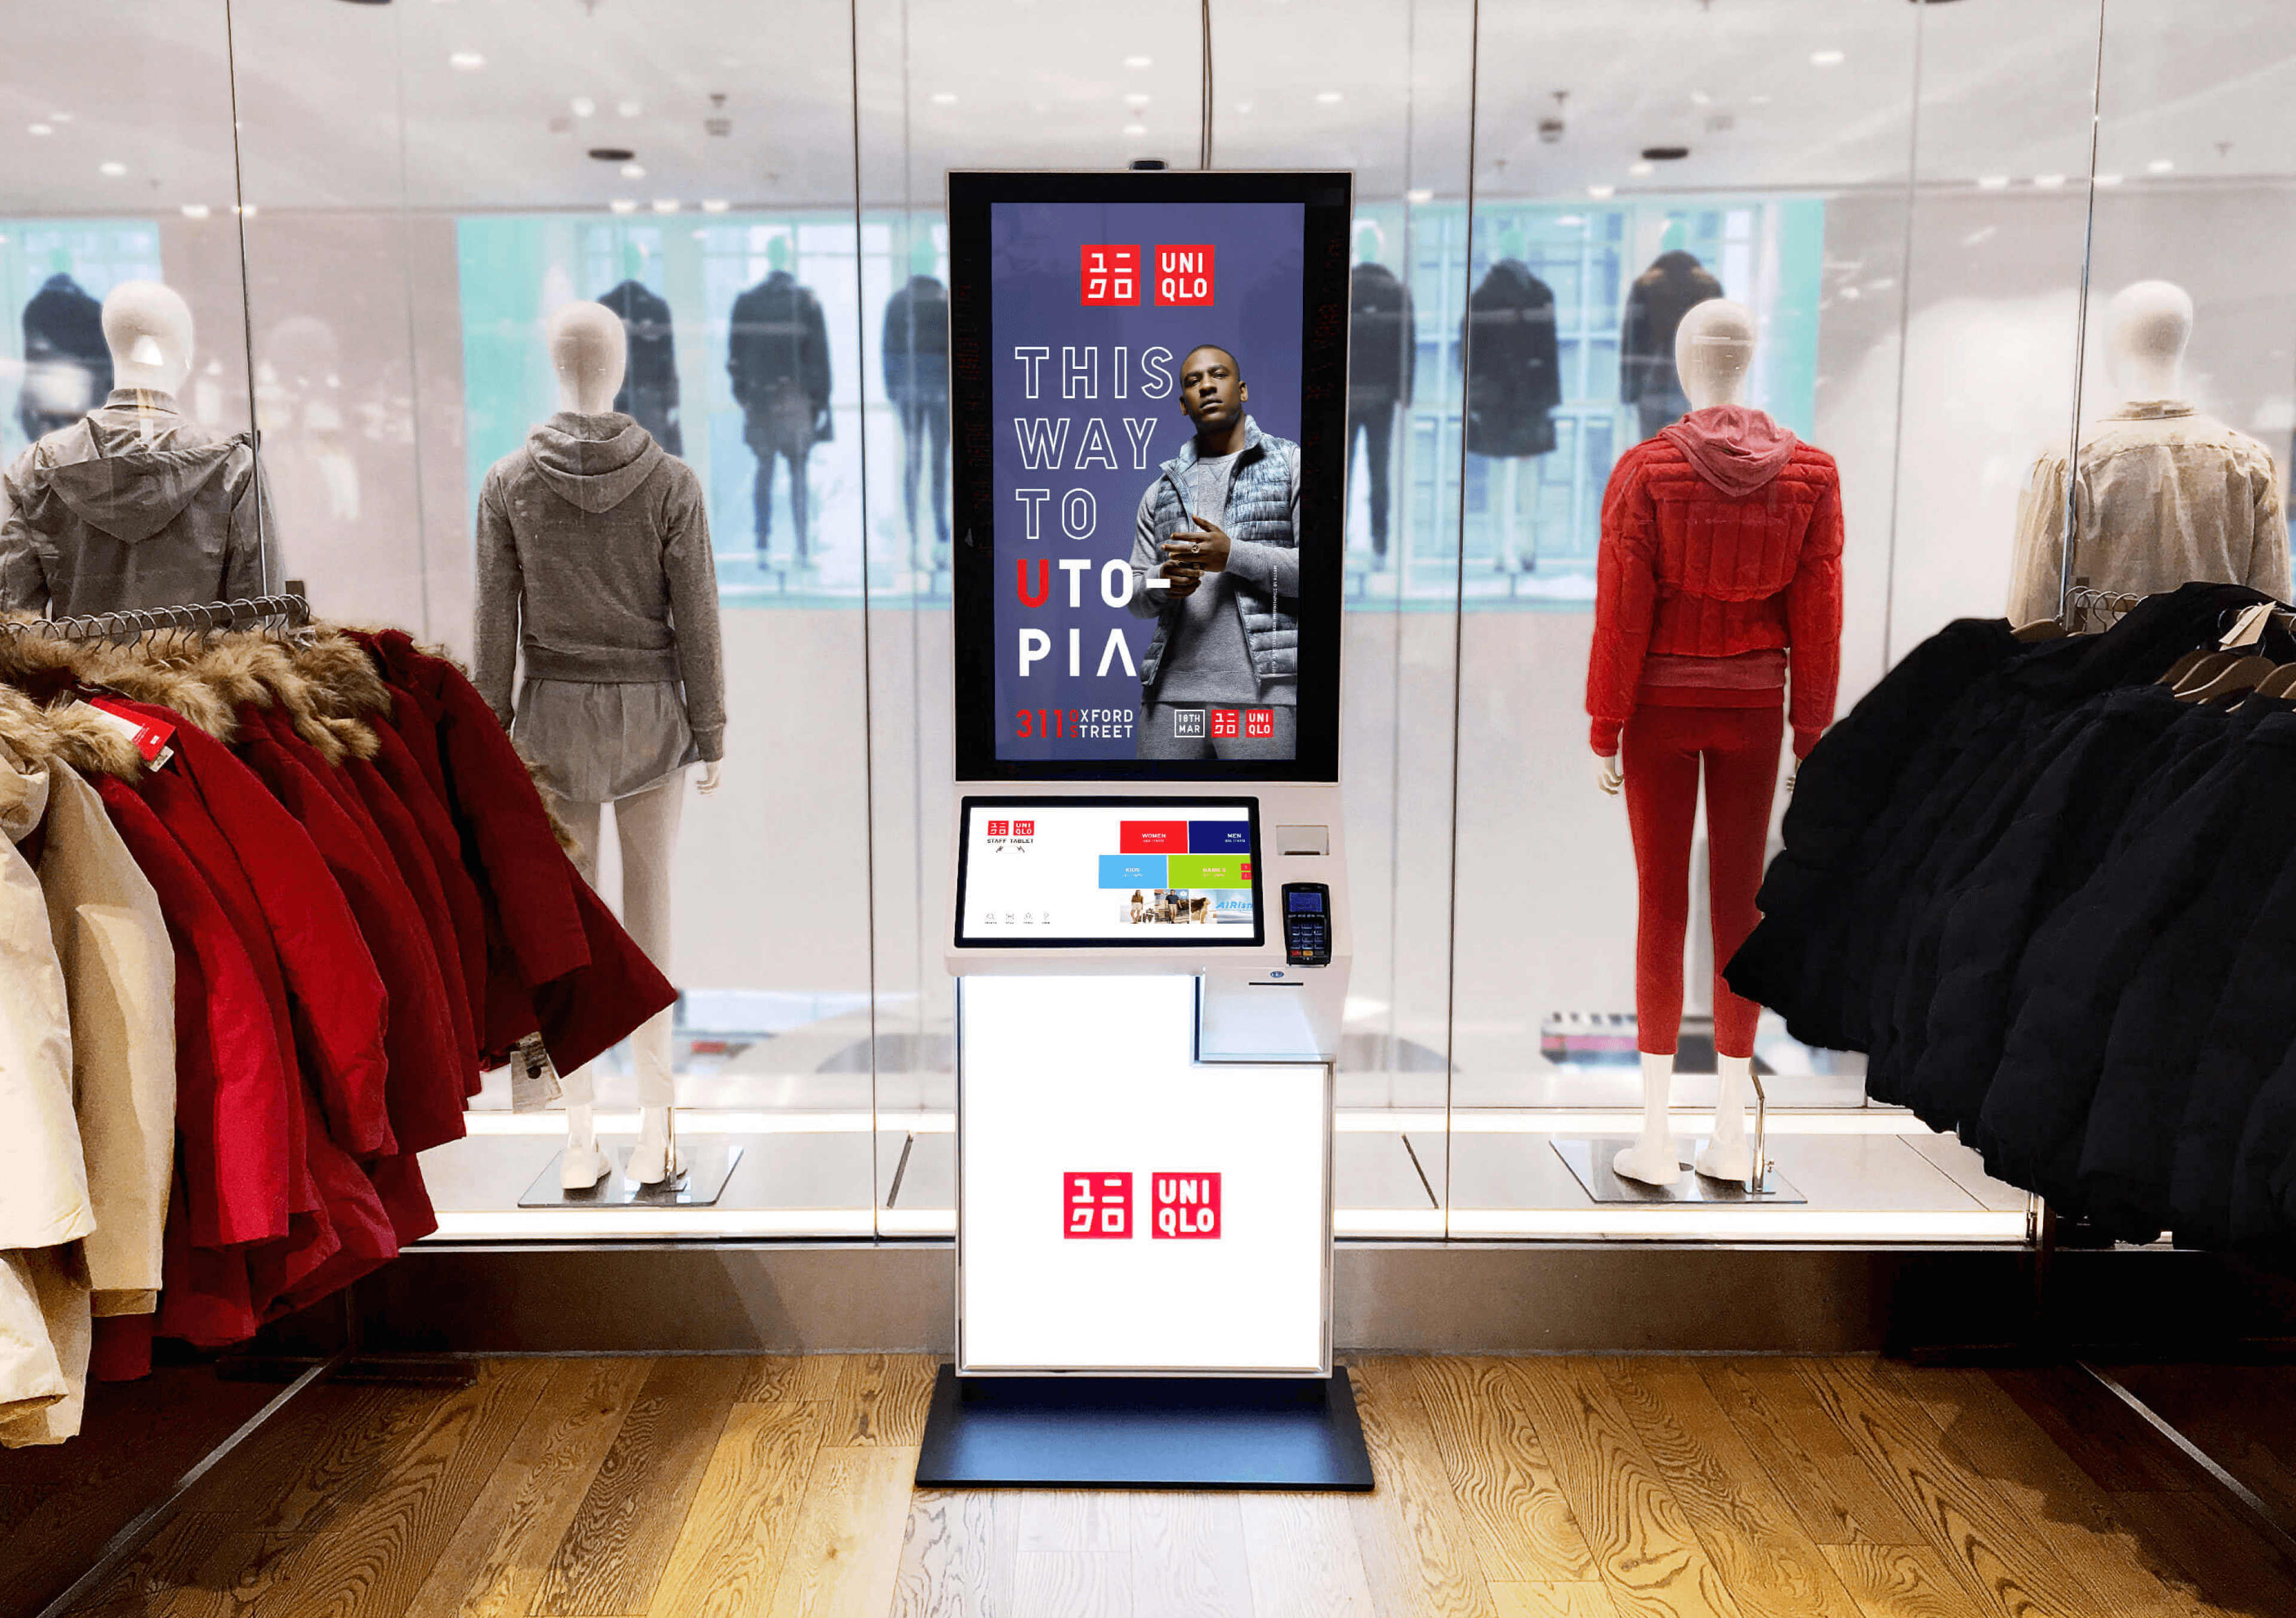
Uniqlo
Making kiosks the go-to tool for shoppers