- Home
- Capabilities
- Performance Optimisation
Performance Optimisation
By combining agile experimentation frameworks, we shift internal behaviours towards a culture of continuous improvement. Identifying big-growth levers with data-led insights and experiments that enhance conversion metrics, improve experiences, and influence internal practices.

Our Performance
Optimisation capabilities:
Methodically qualifying strategies and experiments to align with business objectives, ensuring effective execution.
Crafting and testing high-impact hypotheses to identify growth levers and optimise for maximum performance.
Robust frameworks to measure experiment outcomes, providing real-time data for accurate decision-making.
Embracing iterative processes for progressive enhancement, rapidly optimising based on data-led feedback.
Rigorously validating effectiveness with evolving market intelligence and customer dynamics.
Transition from a top-down decision tree process, to an agile, data qualified, prioritisation framework.
Developing robust performance optimisation capabilities and processes fosters a progressive enhancement mindset that capitalises on existing opportunities.
CRO & Experimentation 🛸
Our CRO & Experimentation frameworks are designed to test the highest risk and reward hypotheses, formulate experiments, and measure results in real time.
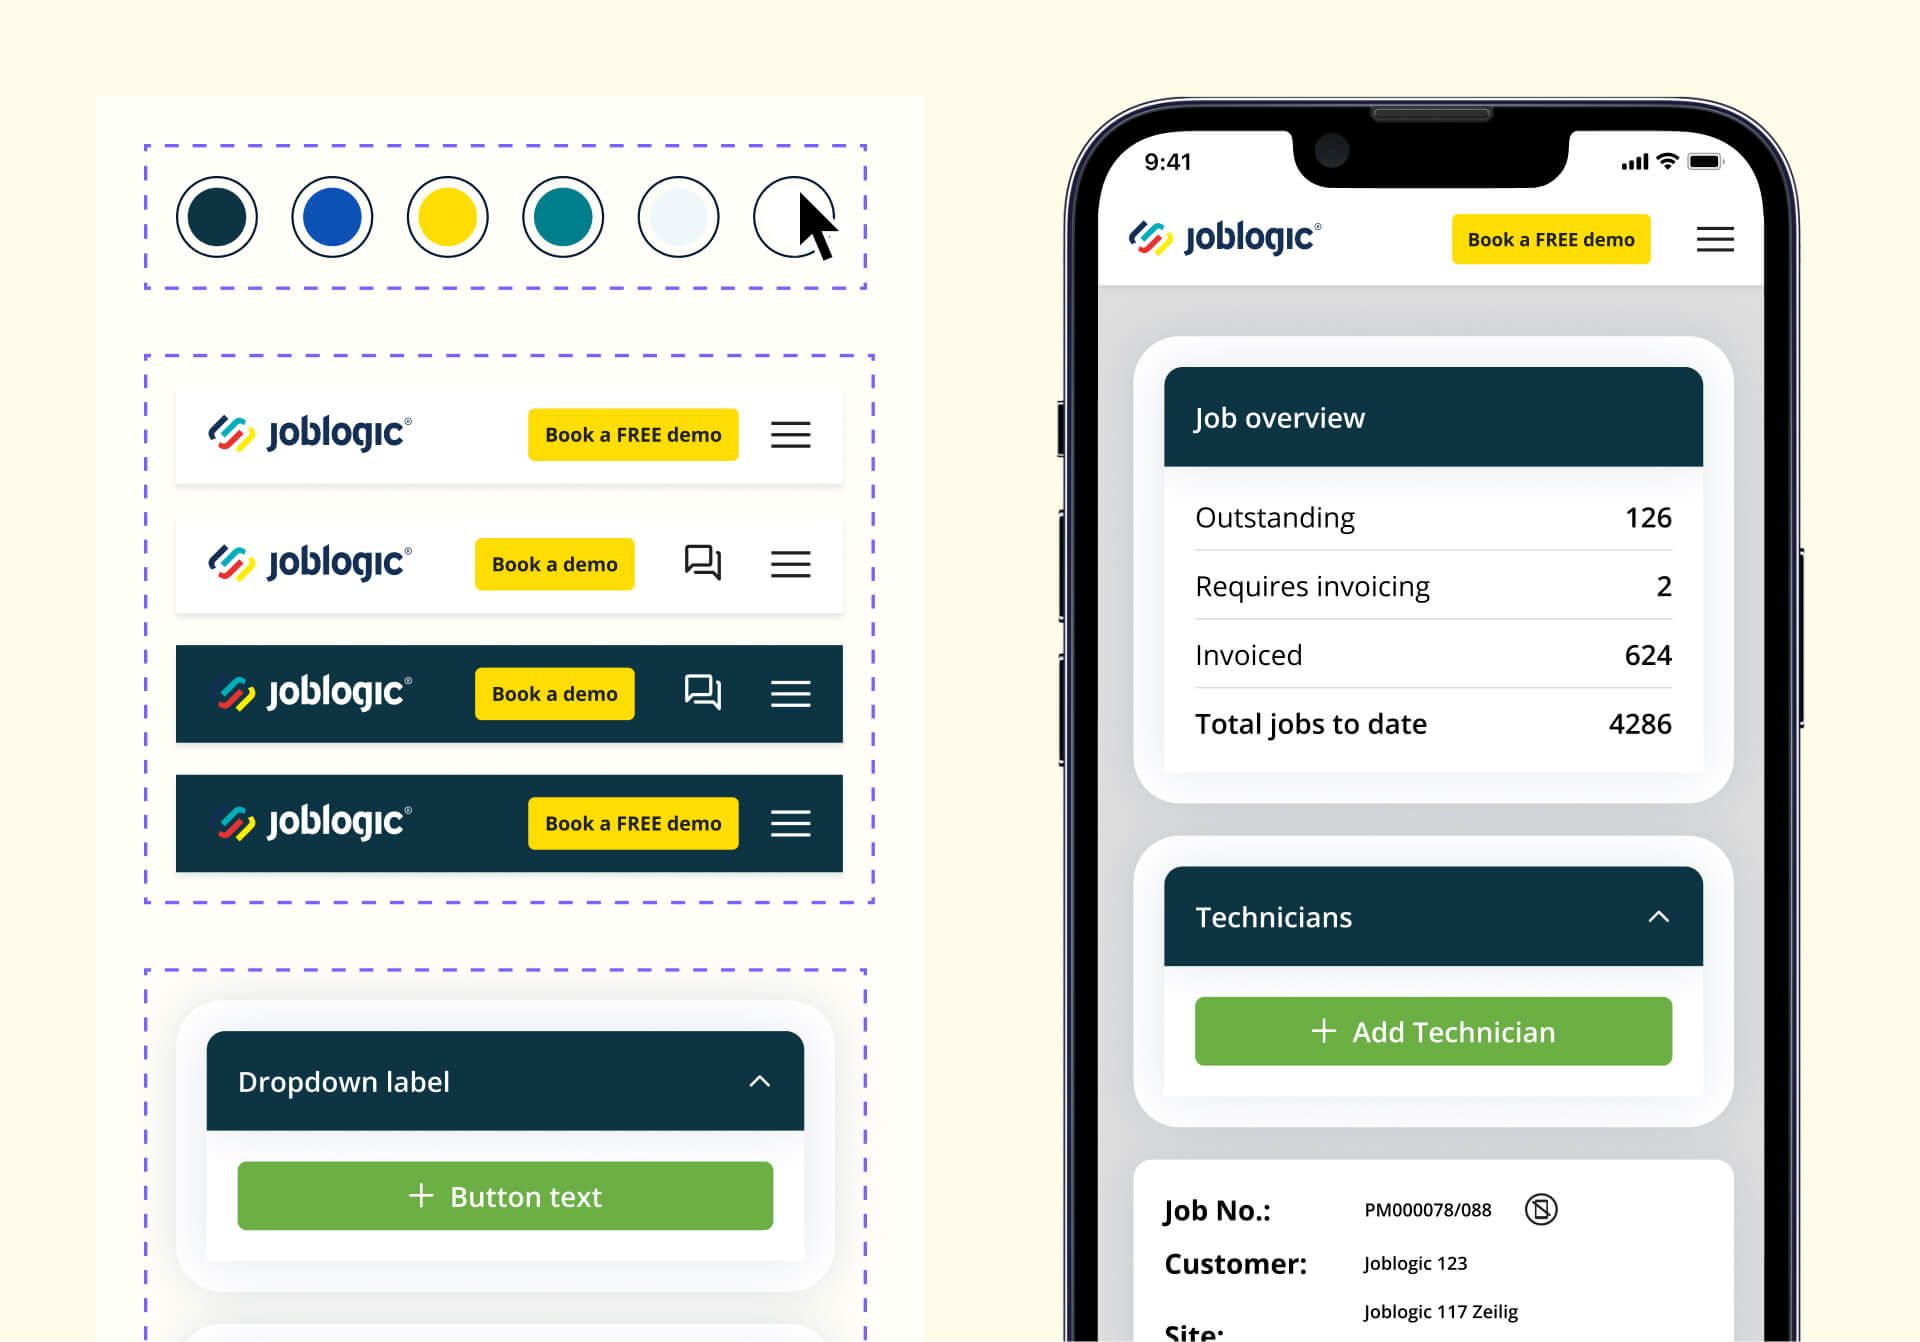
Design Systems 🎨
Build a set of standards to manage common design elements at scale. Incorporating governance, architecture, and scalability across multiple digital products and implementation teams.
Product Sprints 🏃♂️
Time-boxed periods to identify, validate, and build new concepts based on discovery, research, validation, prototyping, and testing to rapidly realise continuous improvement.
Experience Review🚦
Our Experience Review sprint utilises audits, insights, and research methods to expose friction points, validate controllers, and build a qualified backlog of value-added releases.
Backlog Qualification 🥇
Qualify and prioritise backlogs against commercial OKRs and align teams to maximise performance, utilisation, and efficiency. Driving unparalleled value for commercial growth.
Whether you want to leverage our frameworks to boost your internal capabilities, or seek an integrated partnership, we can assist in building or evolving your Performance Optimisation strategies.
For more information about our Performance Optimisation capabilities please complete the form below
We help a variety of organisations
with performance optimisation
- MoM conversion rate of 6.9%
- LFL quarterly revenue of £265K
- MoM conversion rate of 6.9%
- LFL quarterly revenue of £265K
- MoM conversion rate of 6.9%
- LFL quarterly revenue of £265K
- MoM conversion rate of 6.9%
- LFL quarterly revenue of £265K

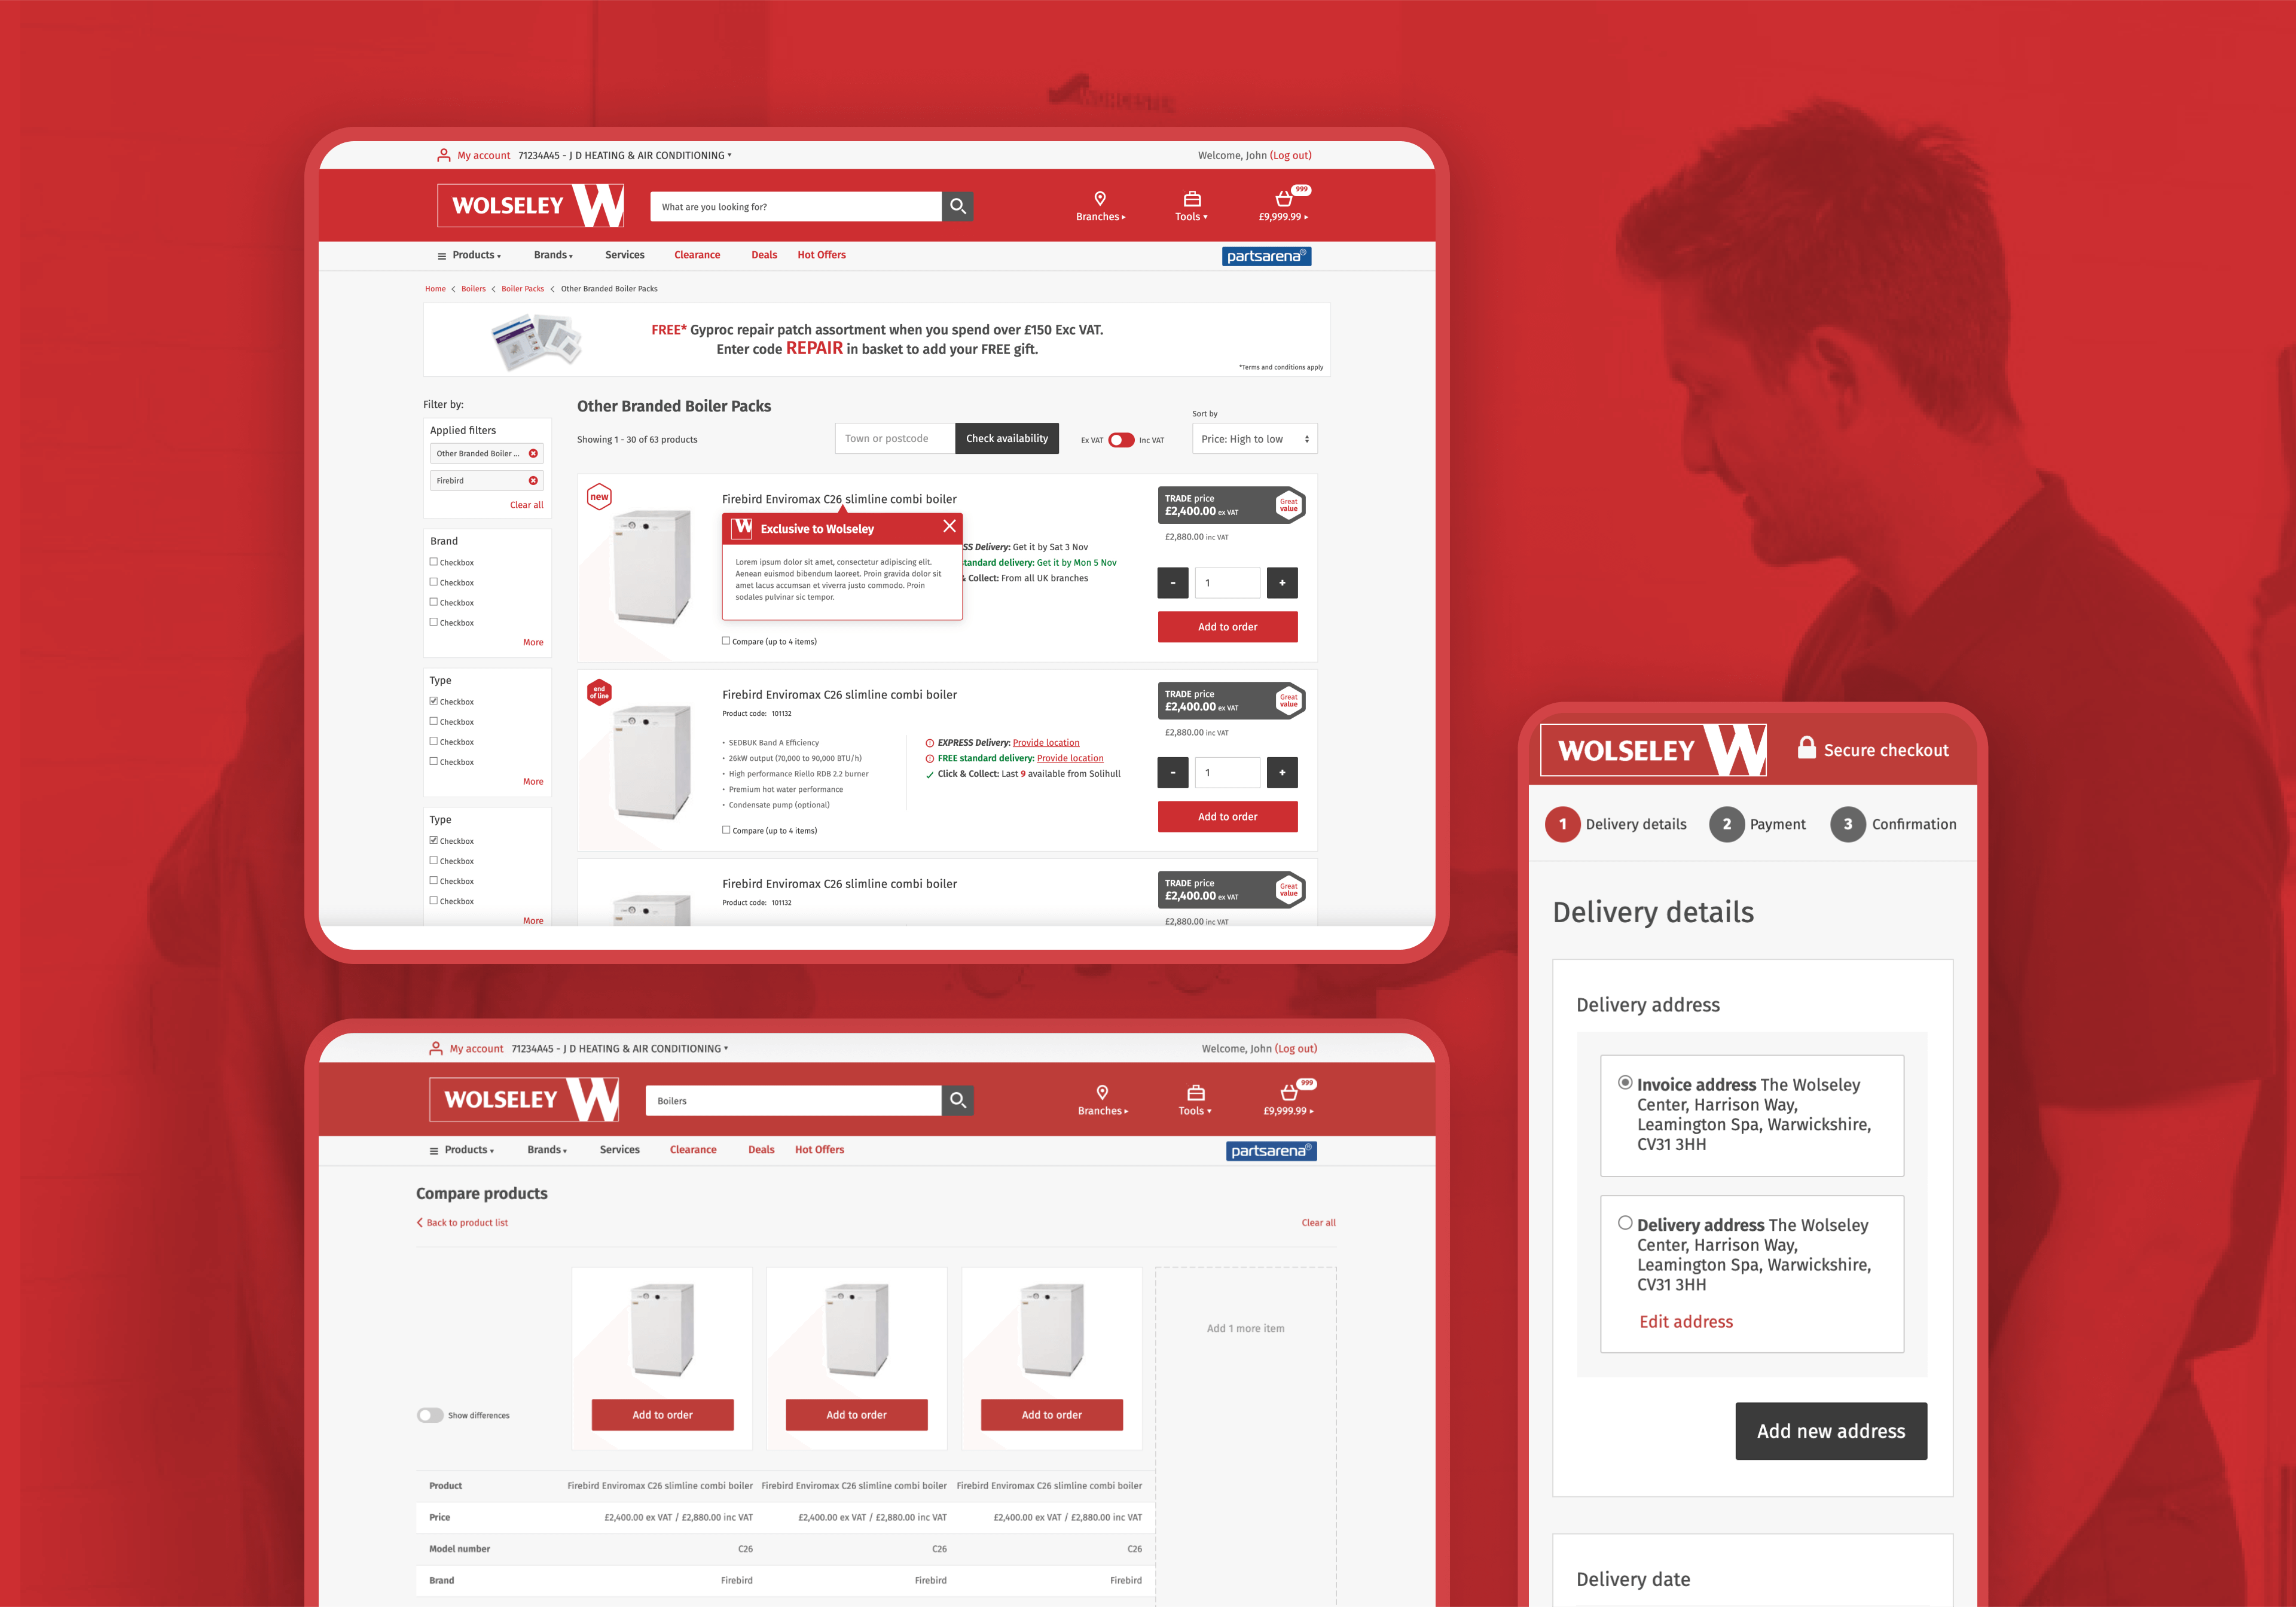
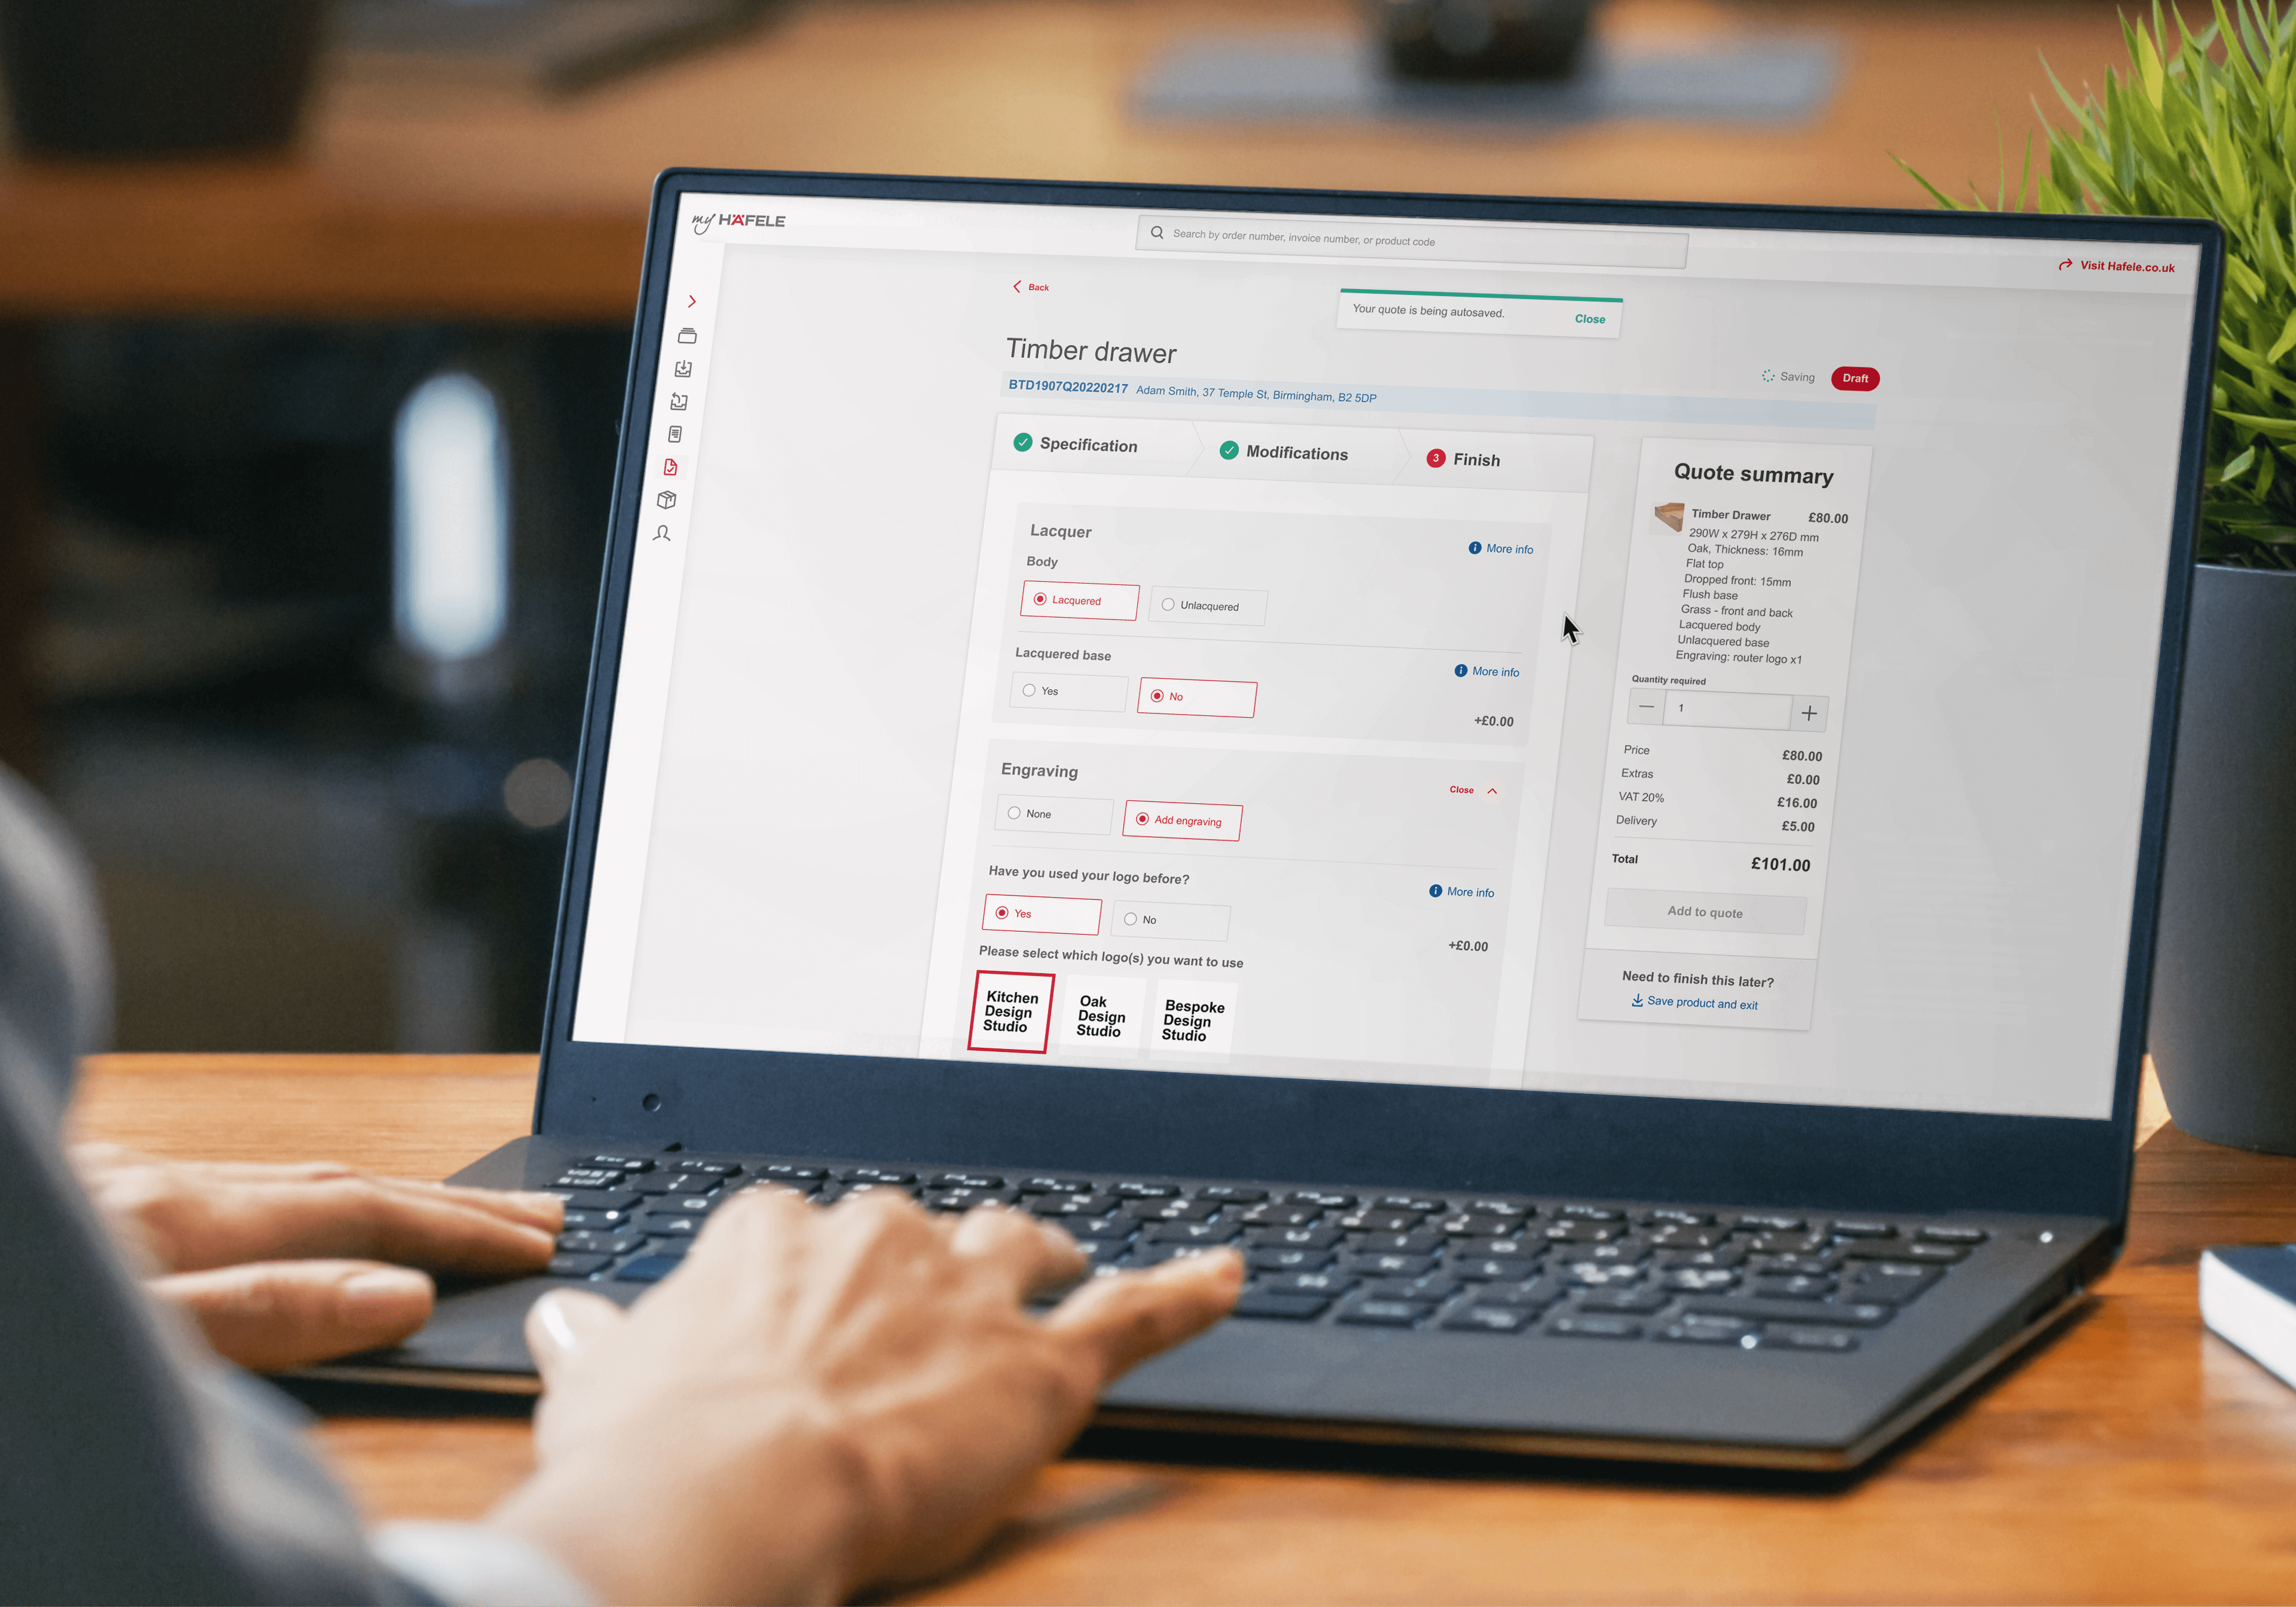
Hafele UK
Profitability through continual optimisation
- 15-days turnaround
- 29 screens designed
- Validated 2 prototypes with 12 participants
- 15-days turnaround
- 29 screens designed
- Validated 2 prototypes with 12 participants
- 15-days turnaround
- 29 screens designed
- Validated 2 prototypes with 12 participants
- 15-days turnaround
- 29 screens designed
- Validated 2 prototypes with 12 participants
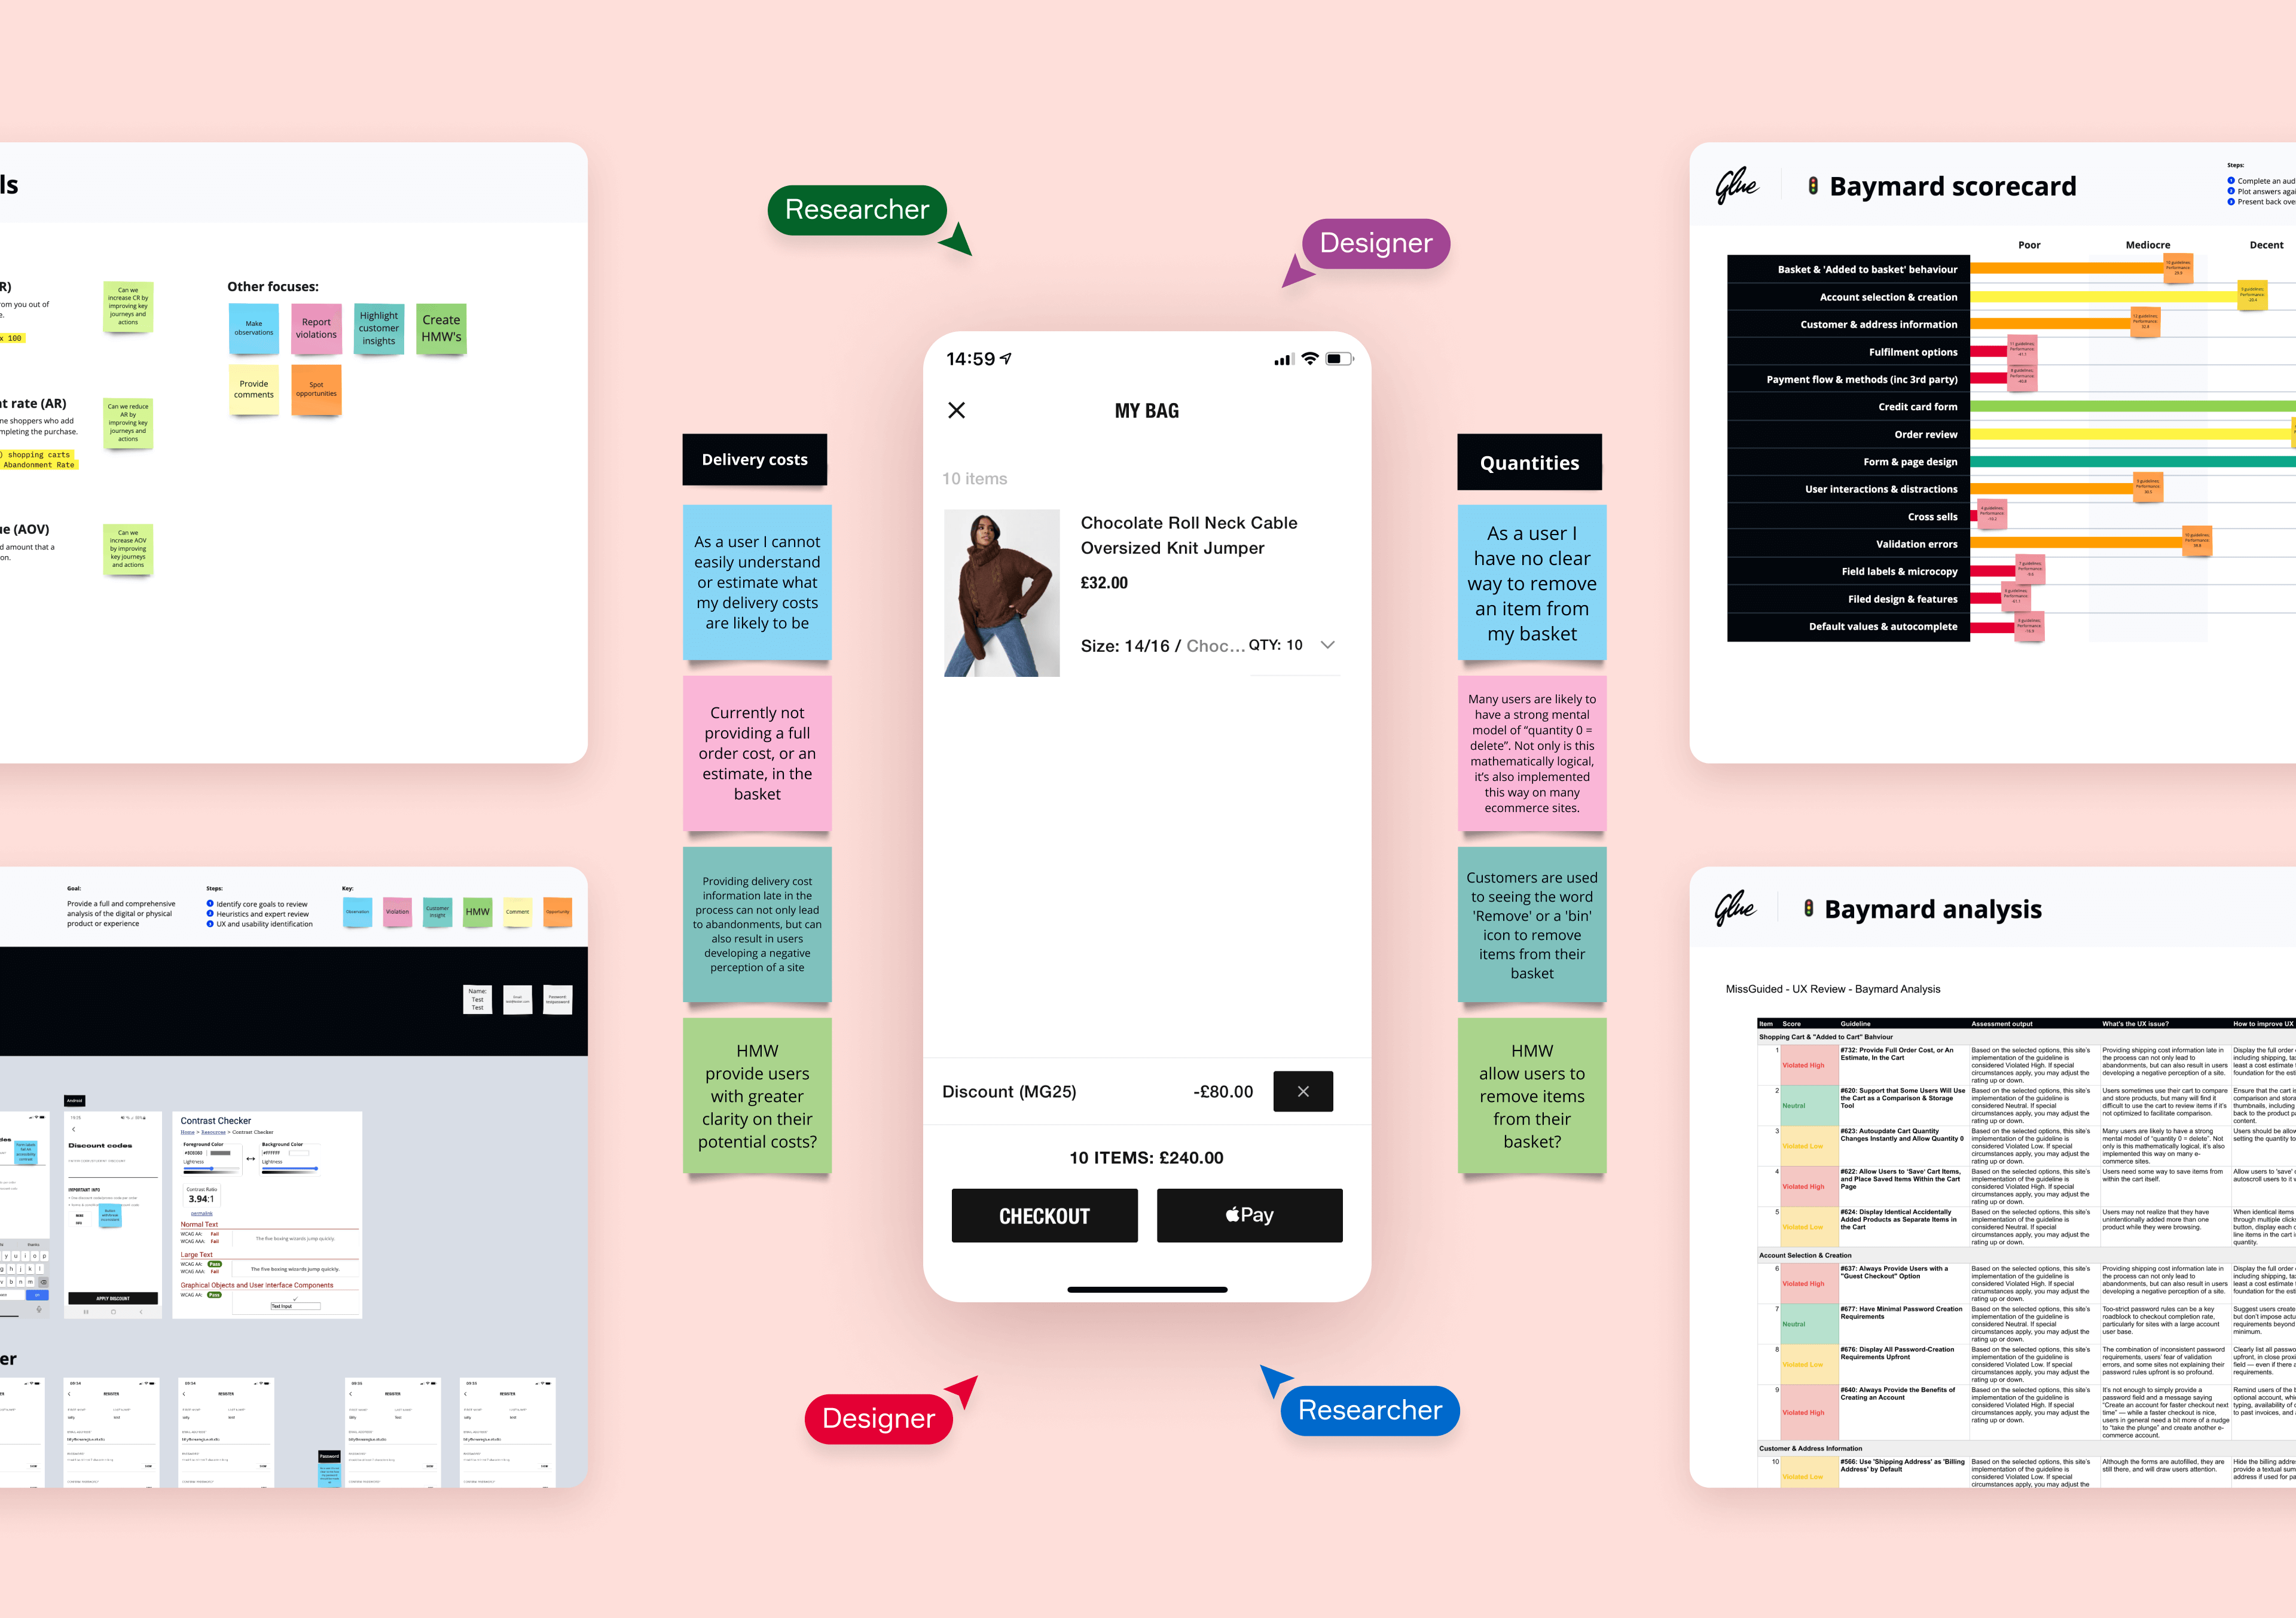
Missguided
App checkout design and validation at speed
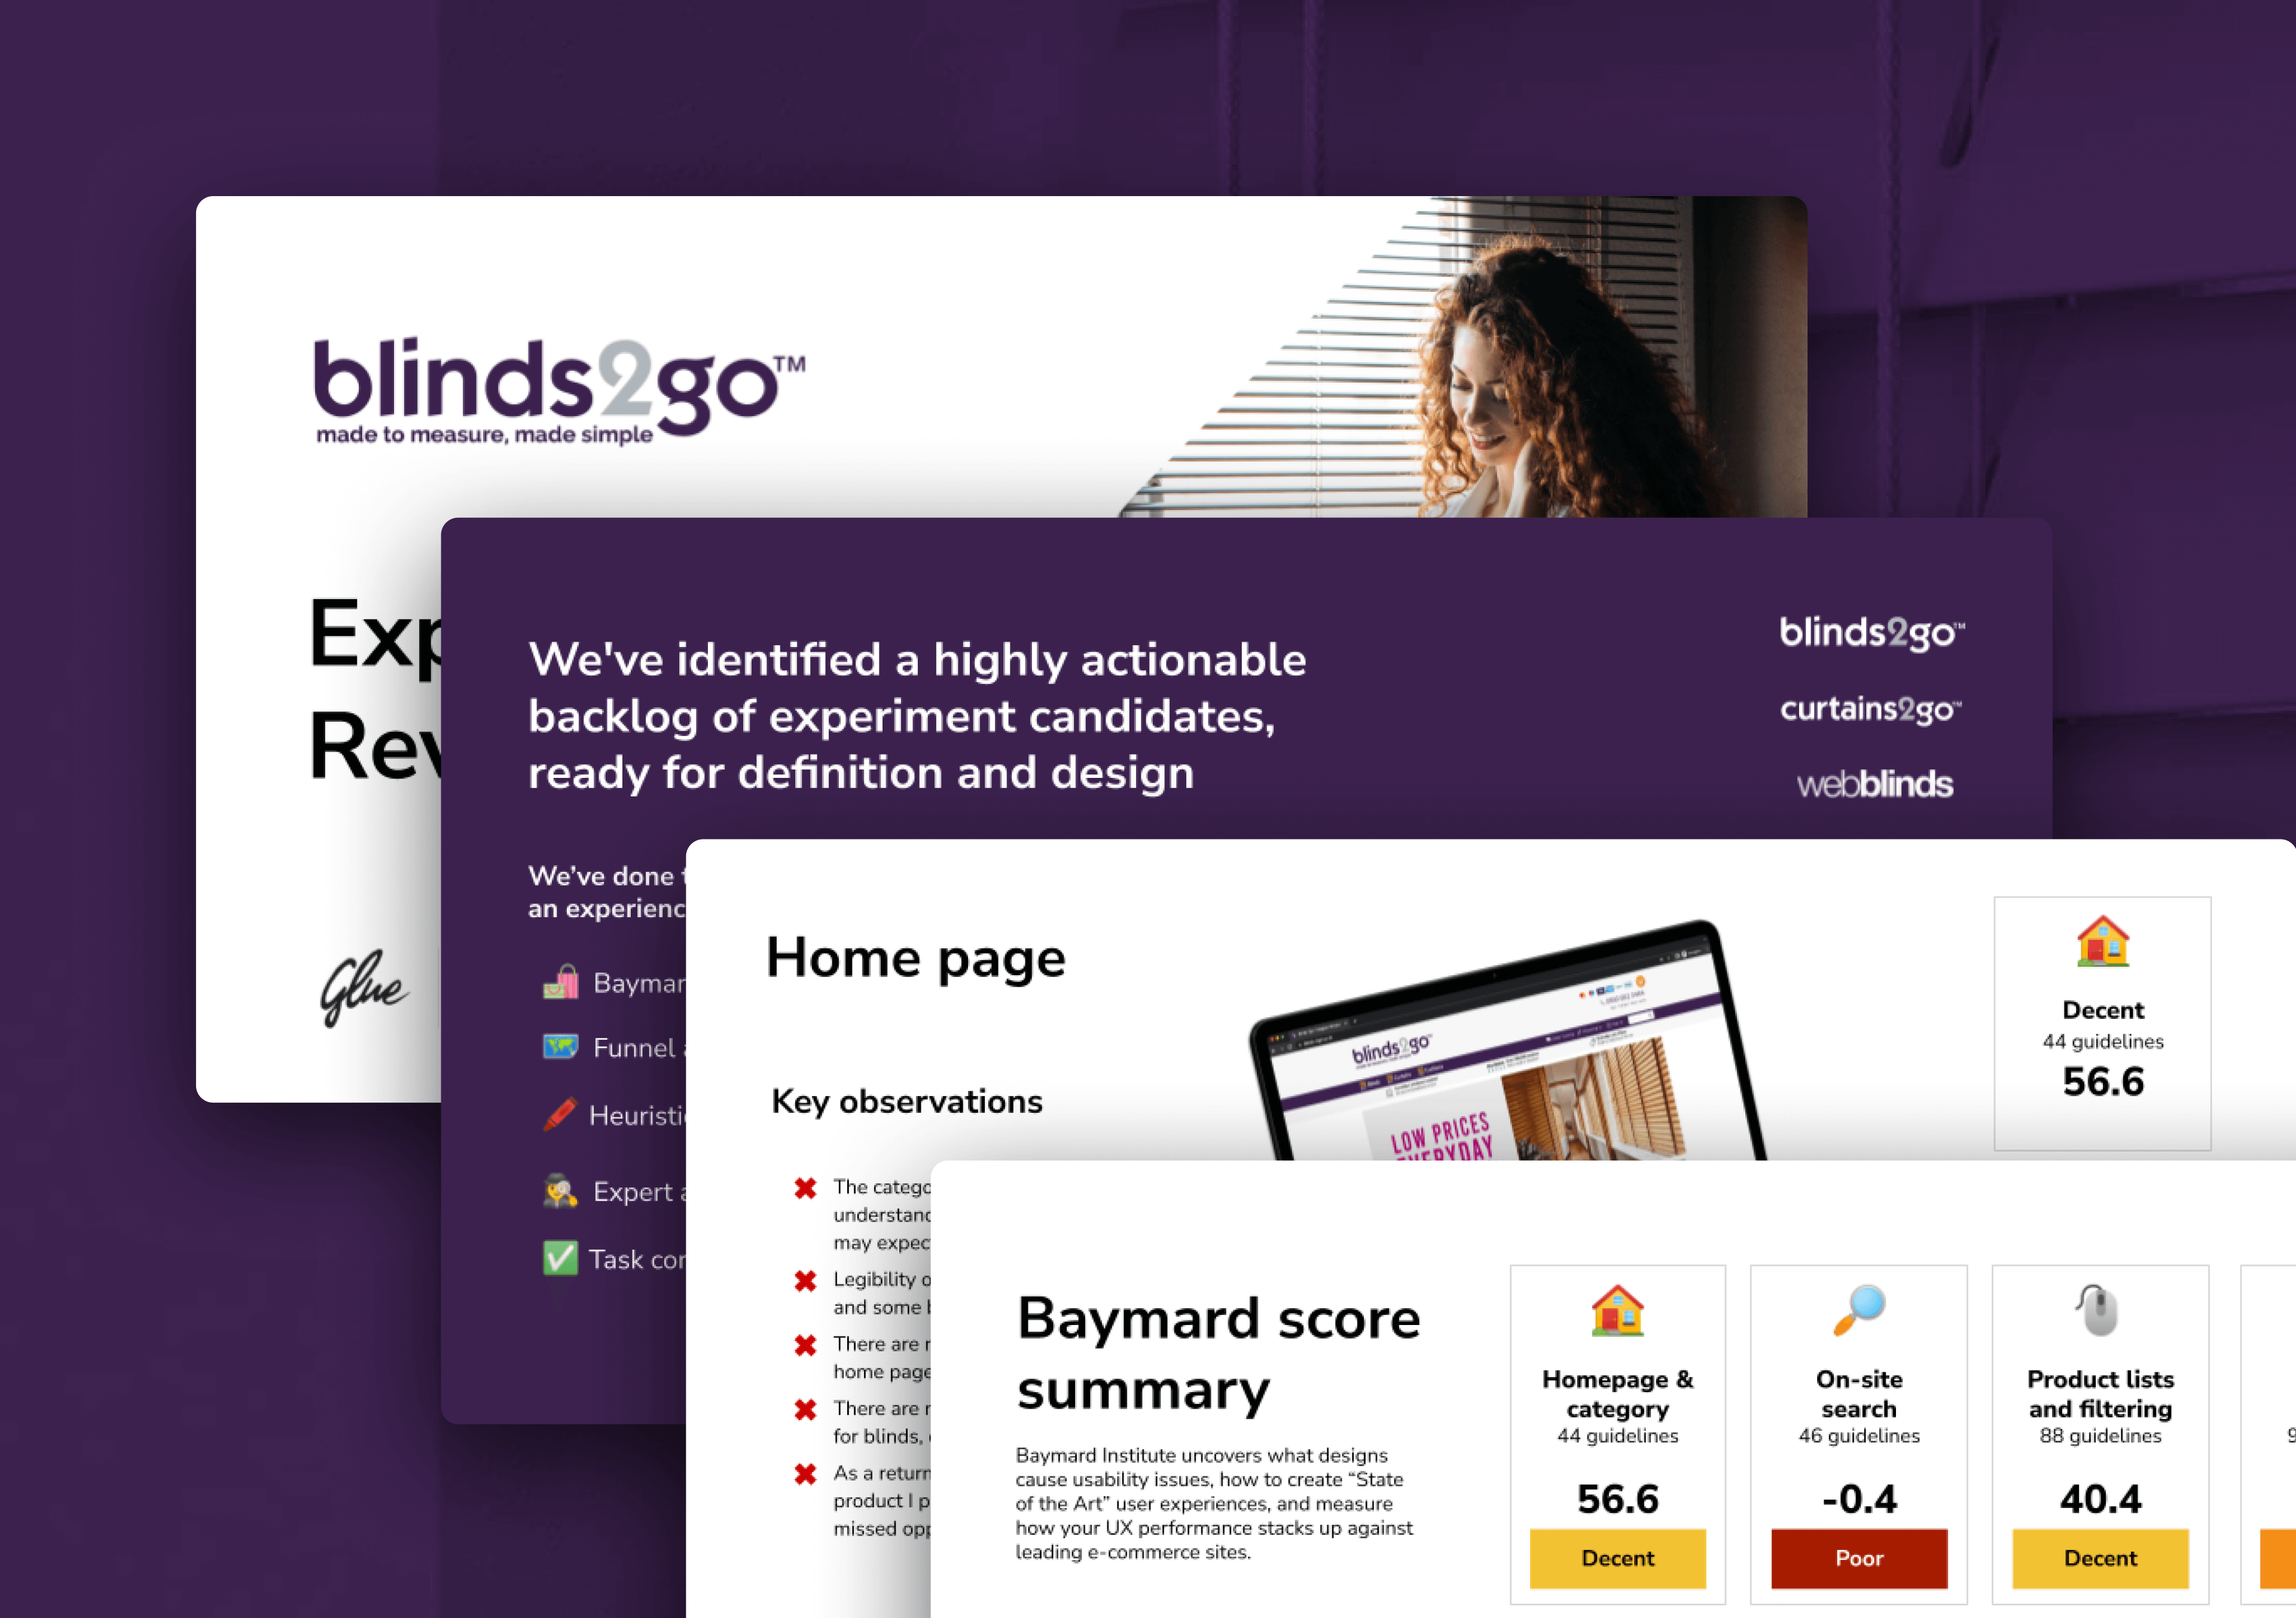
- 41 experiment candidates identified
- 128 events IDs created for tracking
- Delivered in 2-weeks
- 41 experiment candidates identified
- 128 events IDs created for tracking
- Delivered in 2-weeks
- 41 experiment candidates identified
- 128 events IDs created for tracking
- Delivered in 2-weeks
- 41 experiment candidates identified
- 128 events IDs created for tracking
- Delivered in 2-weeks
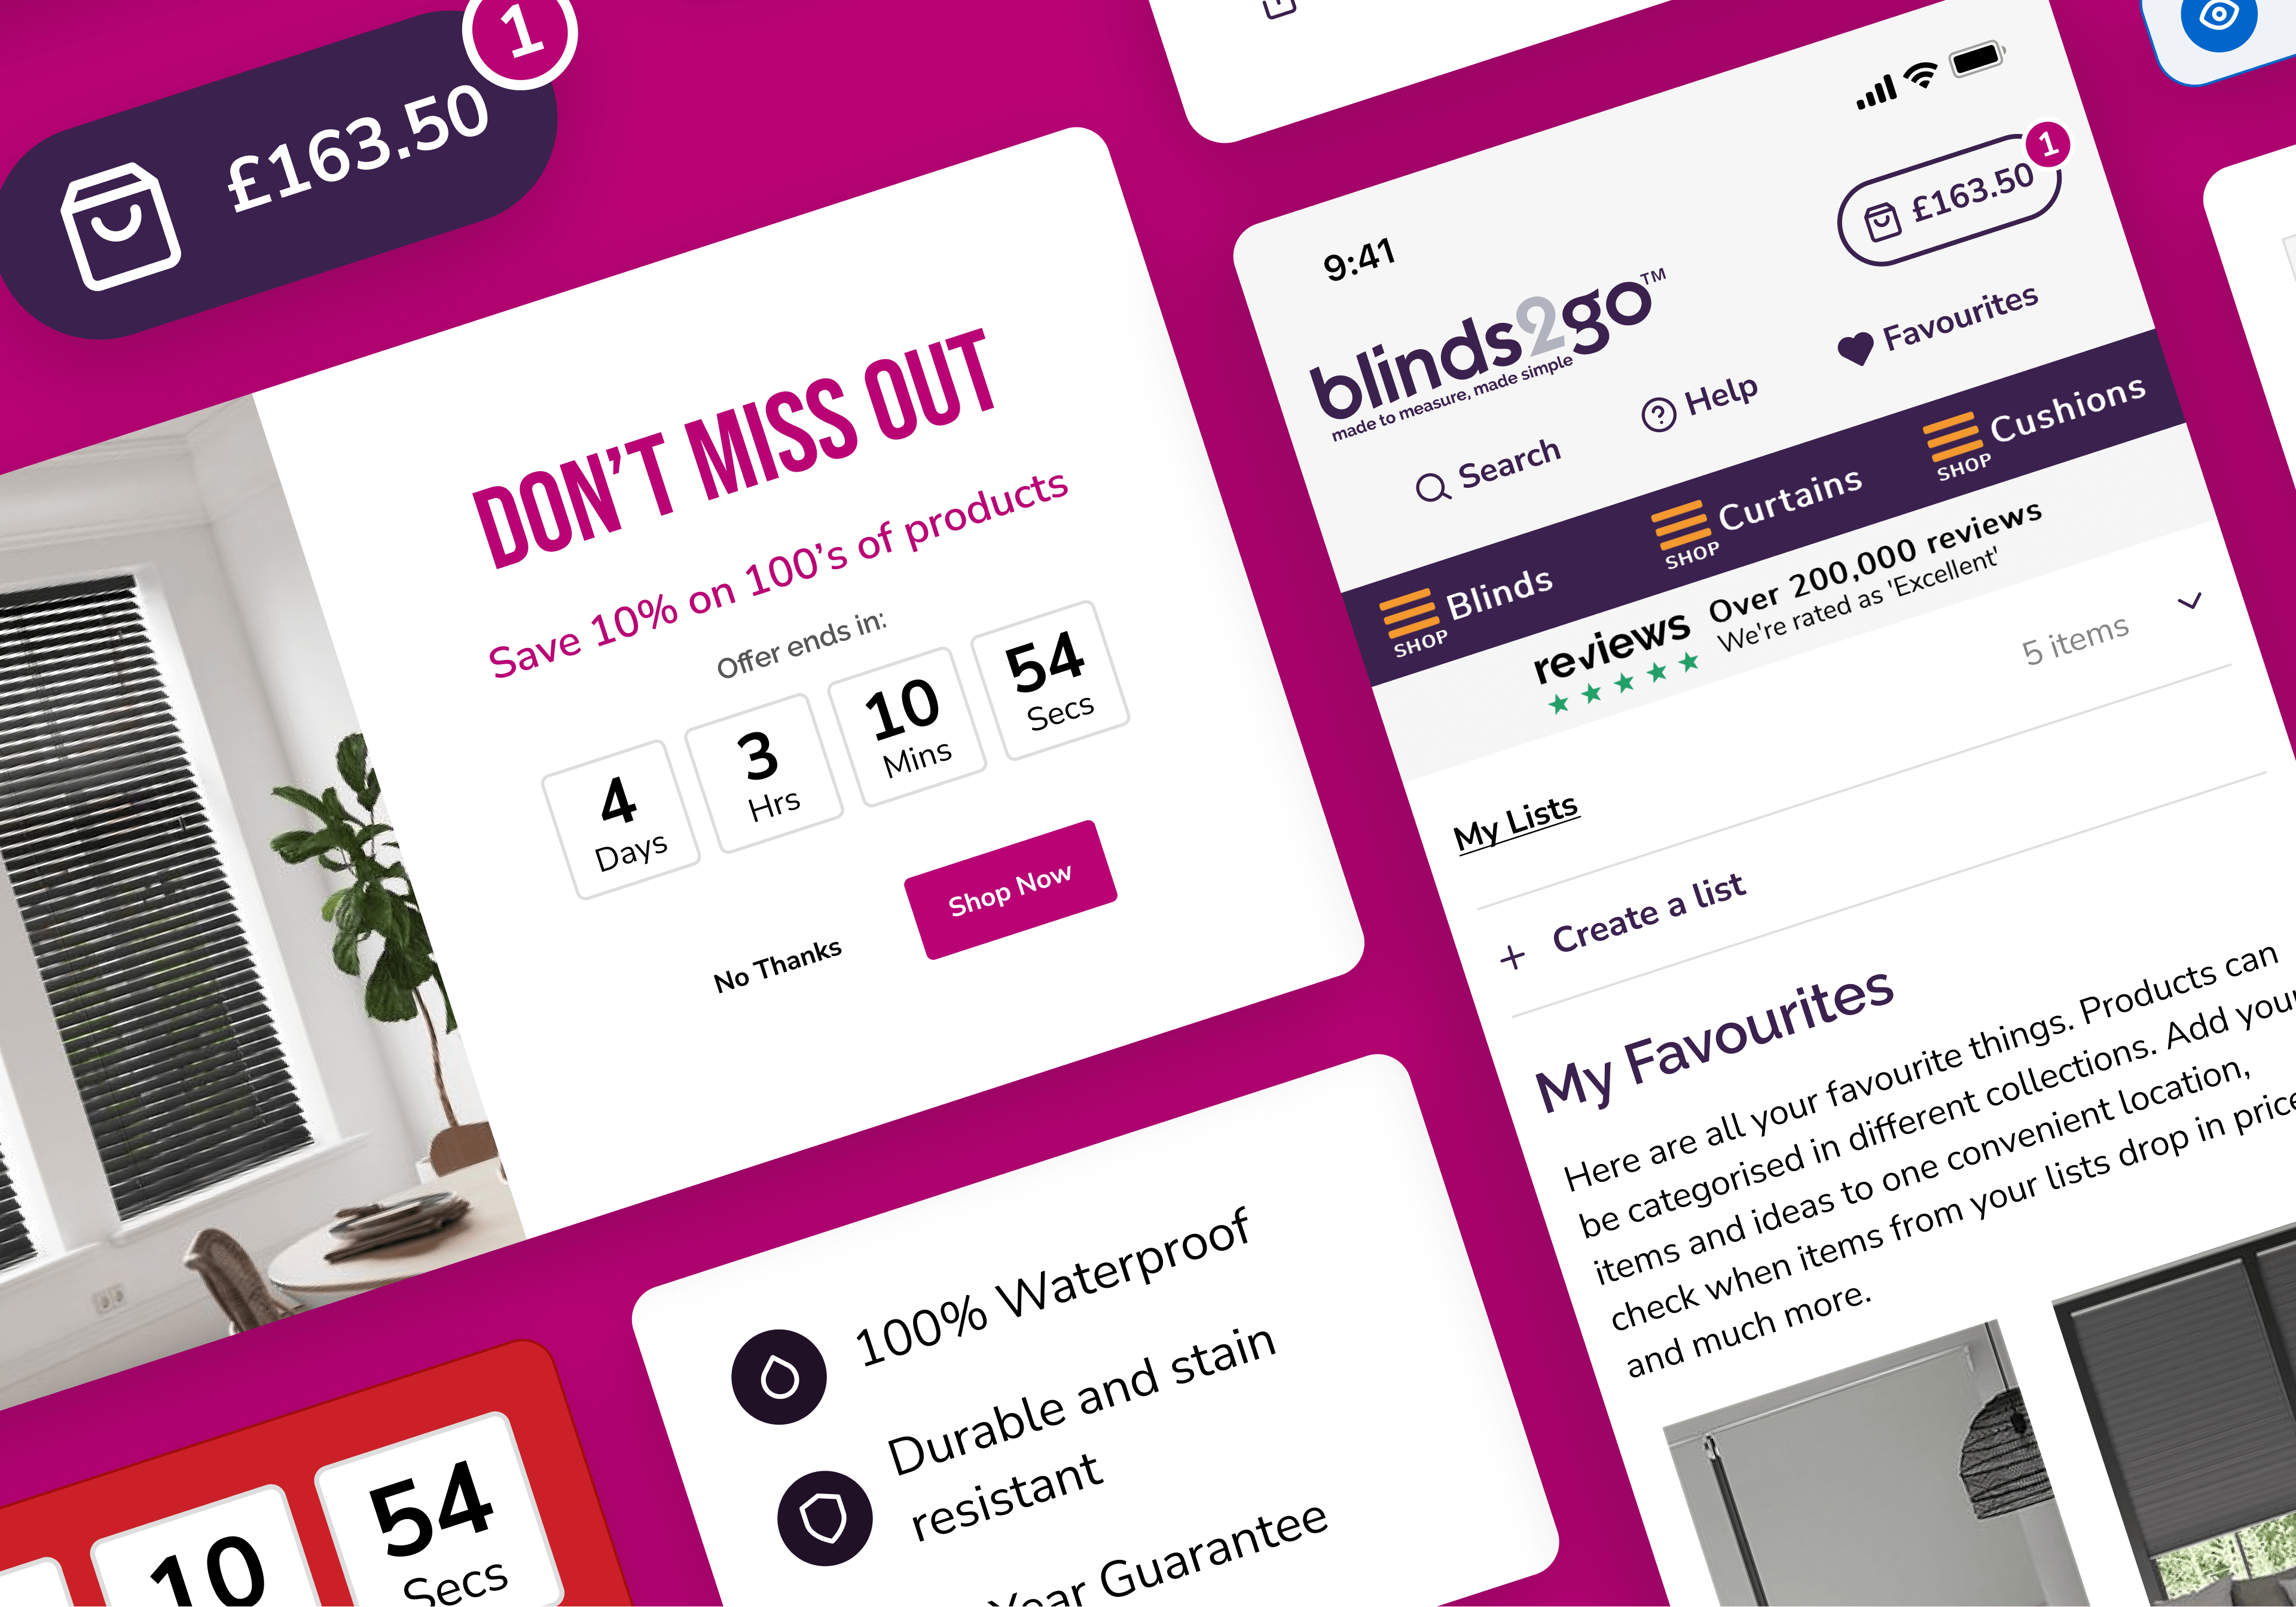
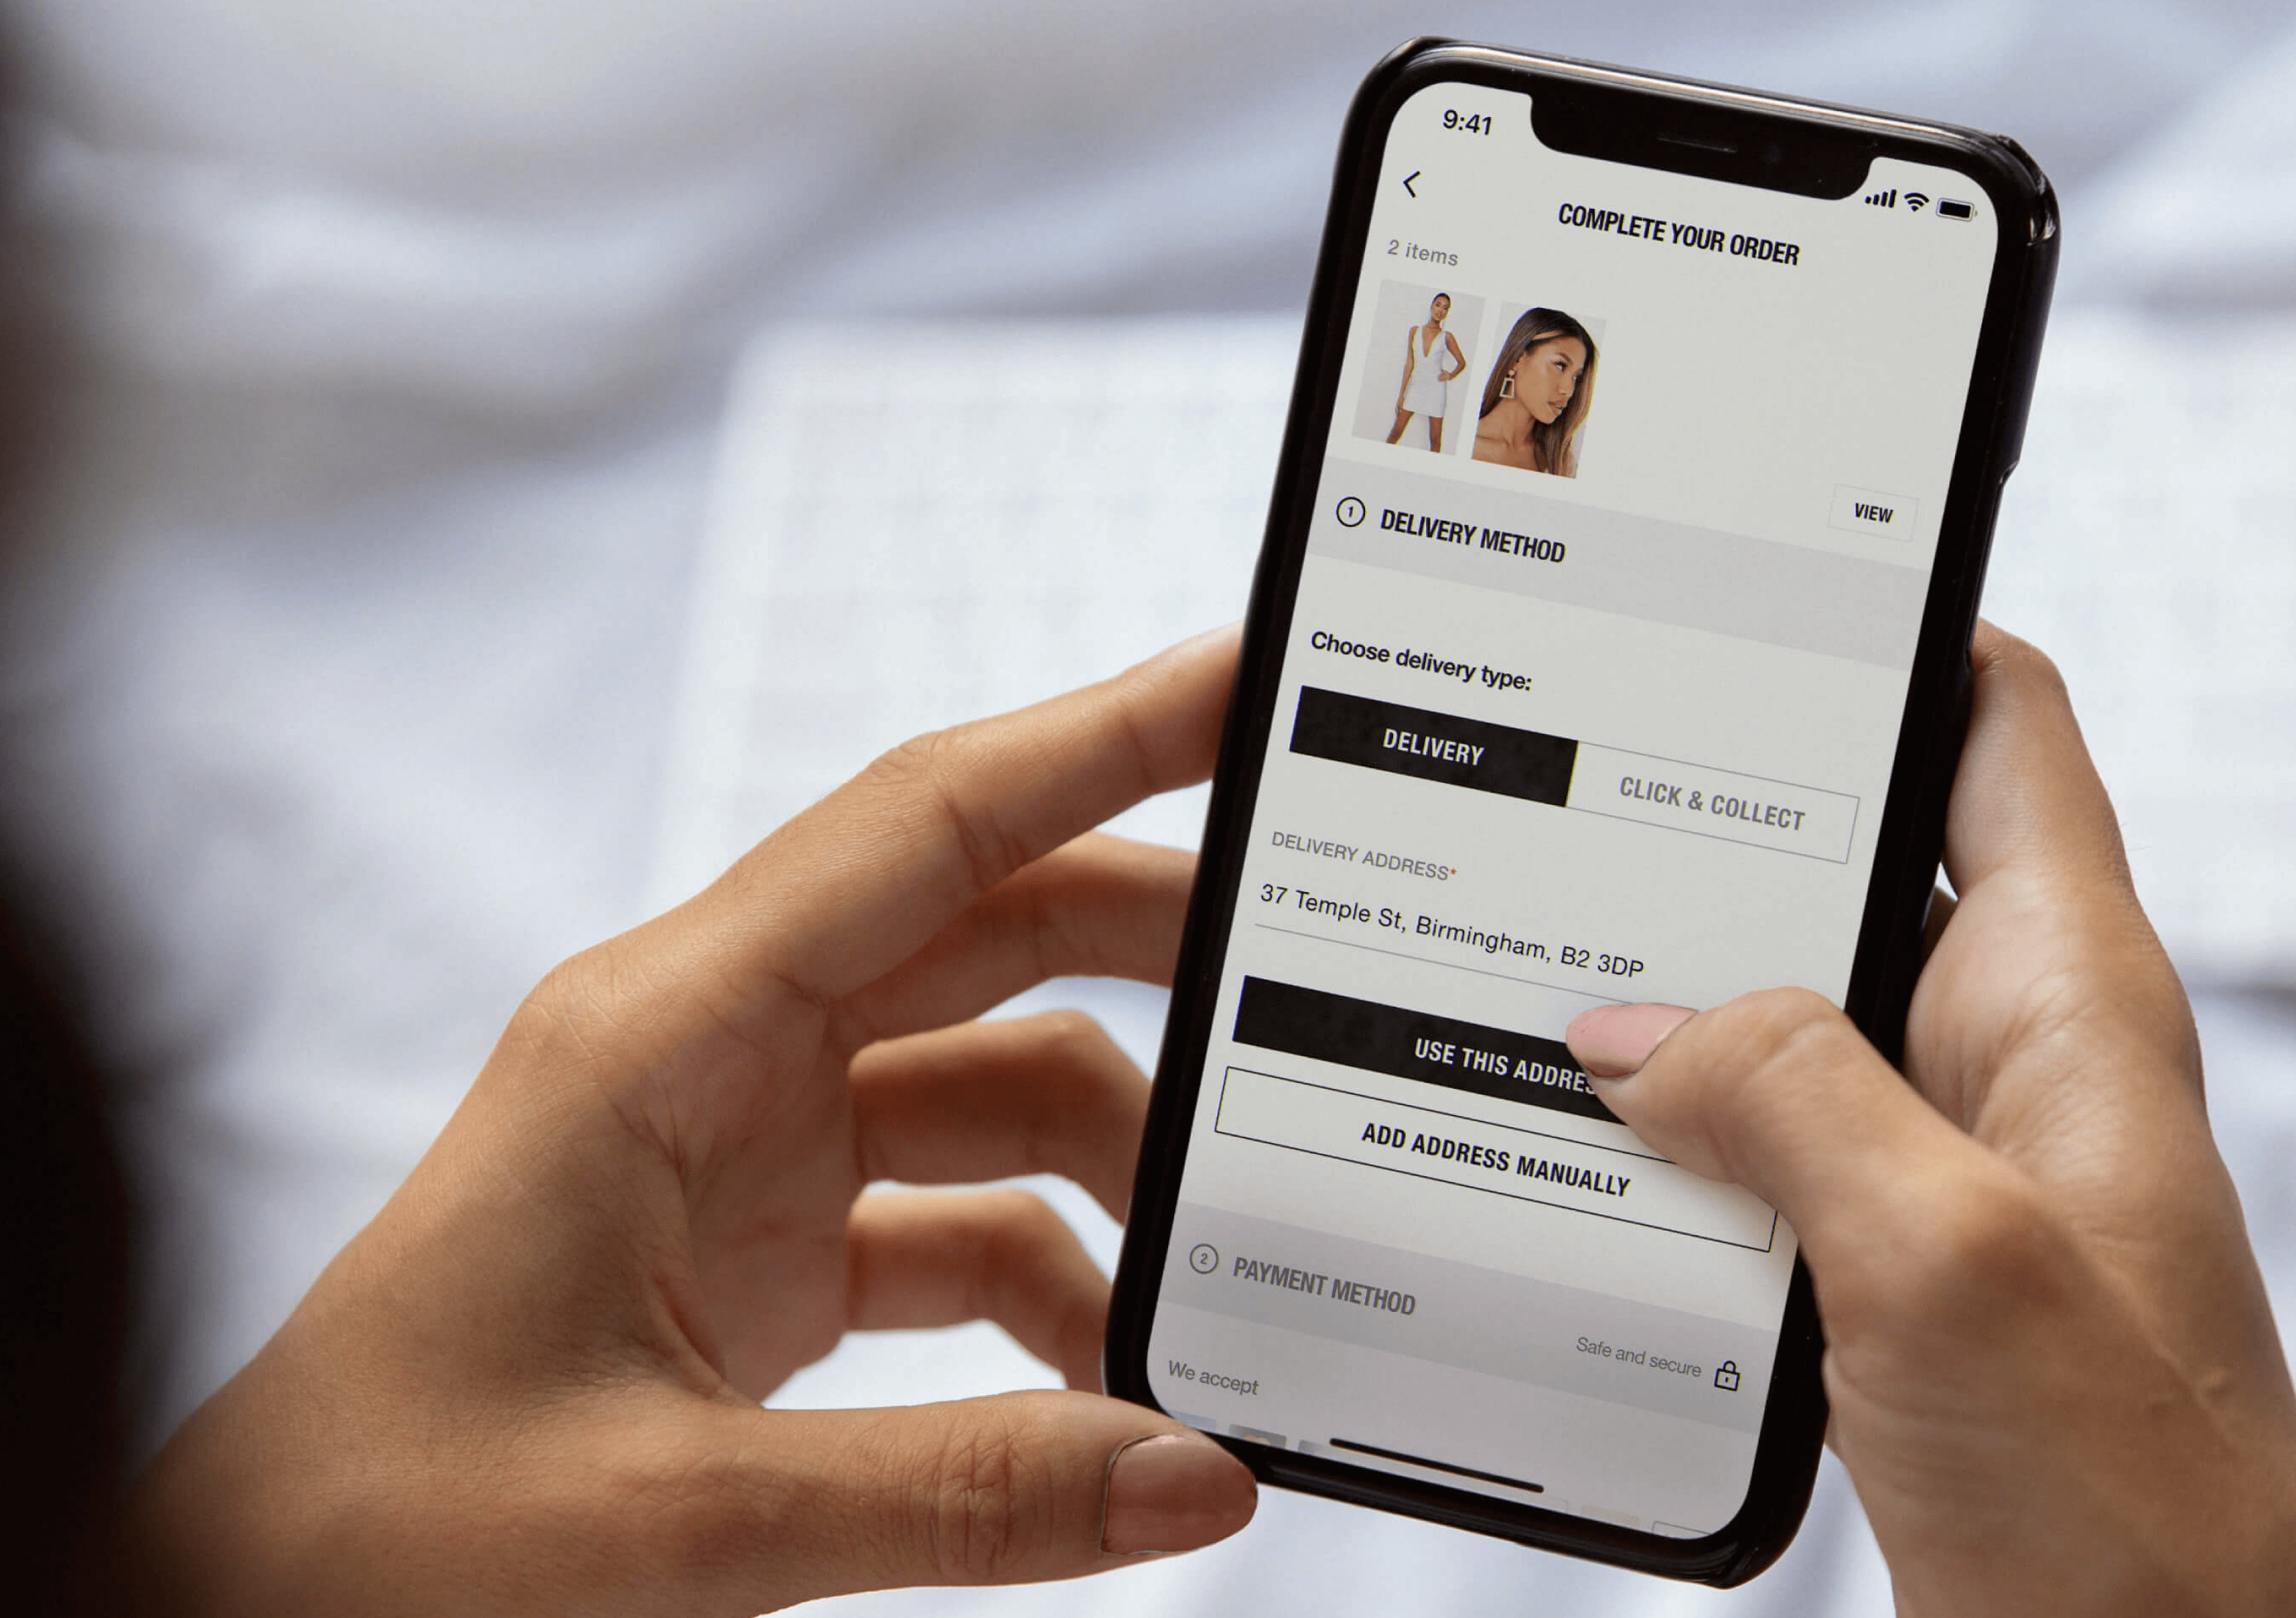
Blinds2Go
Experiment backlog identification
- +£1.03m in monthly lend
- +102% in lead acquisition QoQ
- ROI of ~+10.6% per £1K
- +£1.03m in monthly lend
- +102% in lead acquisition QoQ
- ROI of ~+10.6% per £1K
- +£1.03m in monthly lend
- +102% in lead acquisition QoQ
- ROI of ~+10.6% per £1K
- +£1.03m in monthly lend
- +102% in lead acquisition QoQ
- ROI of ~+10.6% per £1K
BNP Paribas
Marketing, UX and customer experience optimisation
- MoM conversion rate of 6.9%
- LFL quarterly revenue of £265K
- MoM conversion rate of 6.9%
- LFL quarterly revenue of £265K
- MoM conversion rate of 6.9%
- LFL quarterly revenue of £265K
- MoM conversion rate of 6.9%
- LFL quarterly revenue of £265K
Hafele UK
Future-proofing business strategy through UX, data, and optimisation
- Increased conversion rates by 1.62%
- Achieved a 215% in-store adoption uplift
- Delivered in 2 sprints
- Increased conversion rates by 1.62%
- Achieved a 215% in-store adoption uplift
- Delivered in 2 sprints
- Increased conversion rates by 1.62%
- Achieved a 215% in-store adoption uplift
- Delivered in 2 sprints
- Increased conversion rates by 1.62%
- Achieved a 215% in-store adoption uplift
- Delivered in 2 sprints
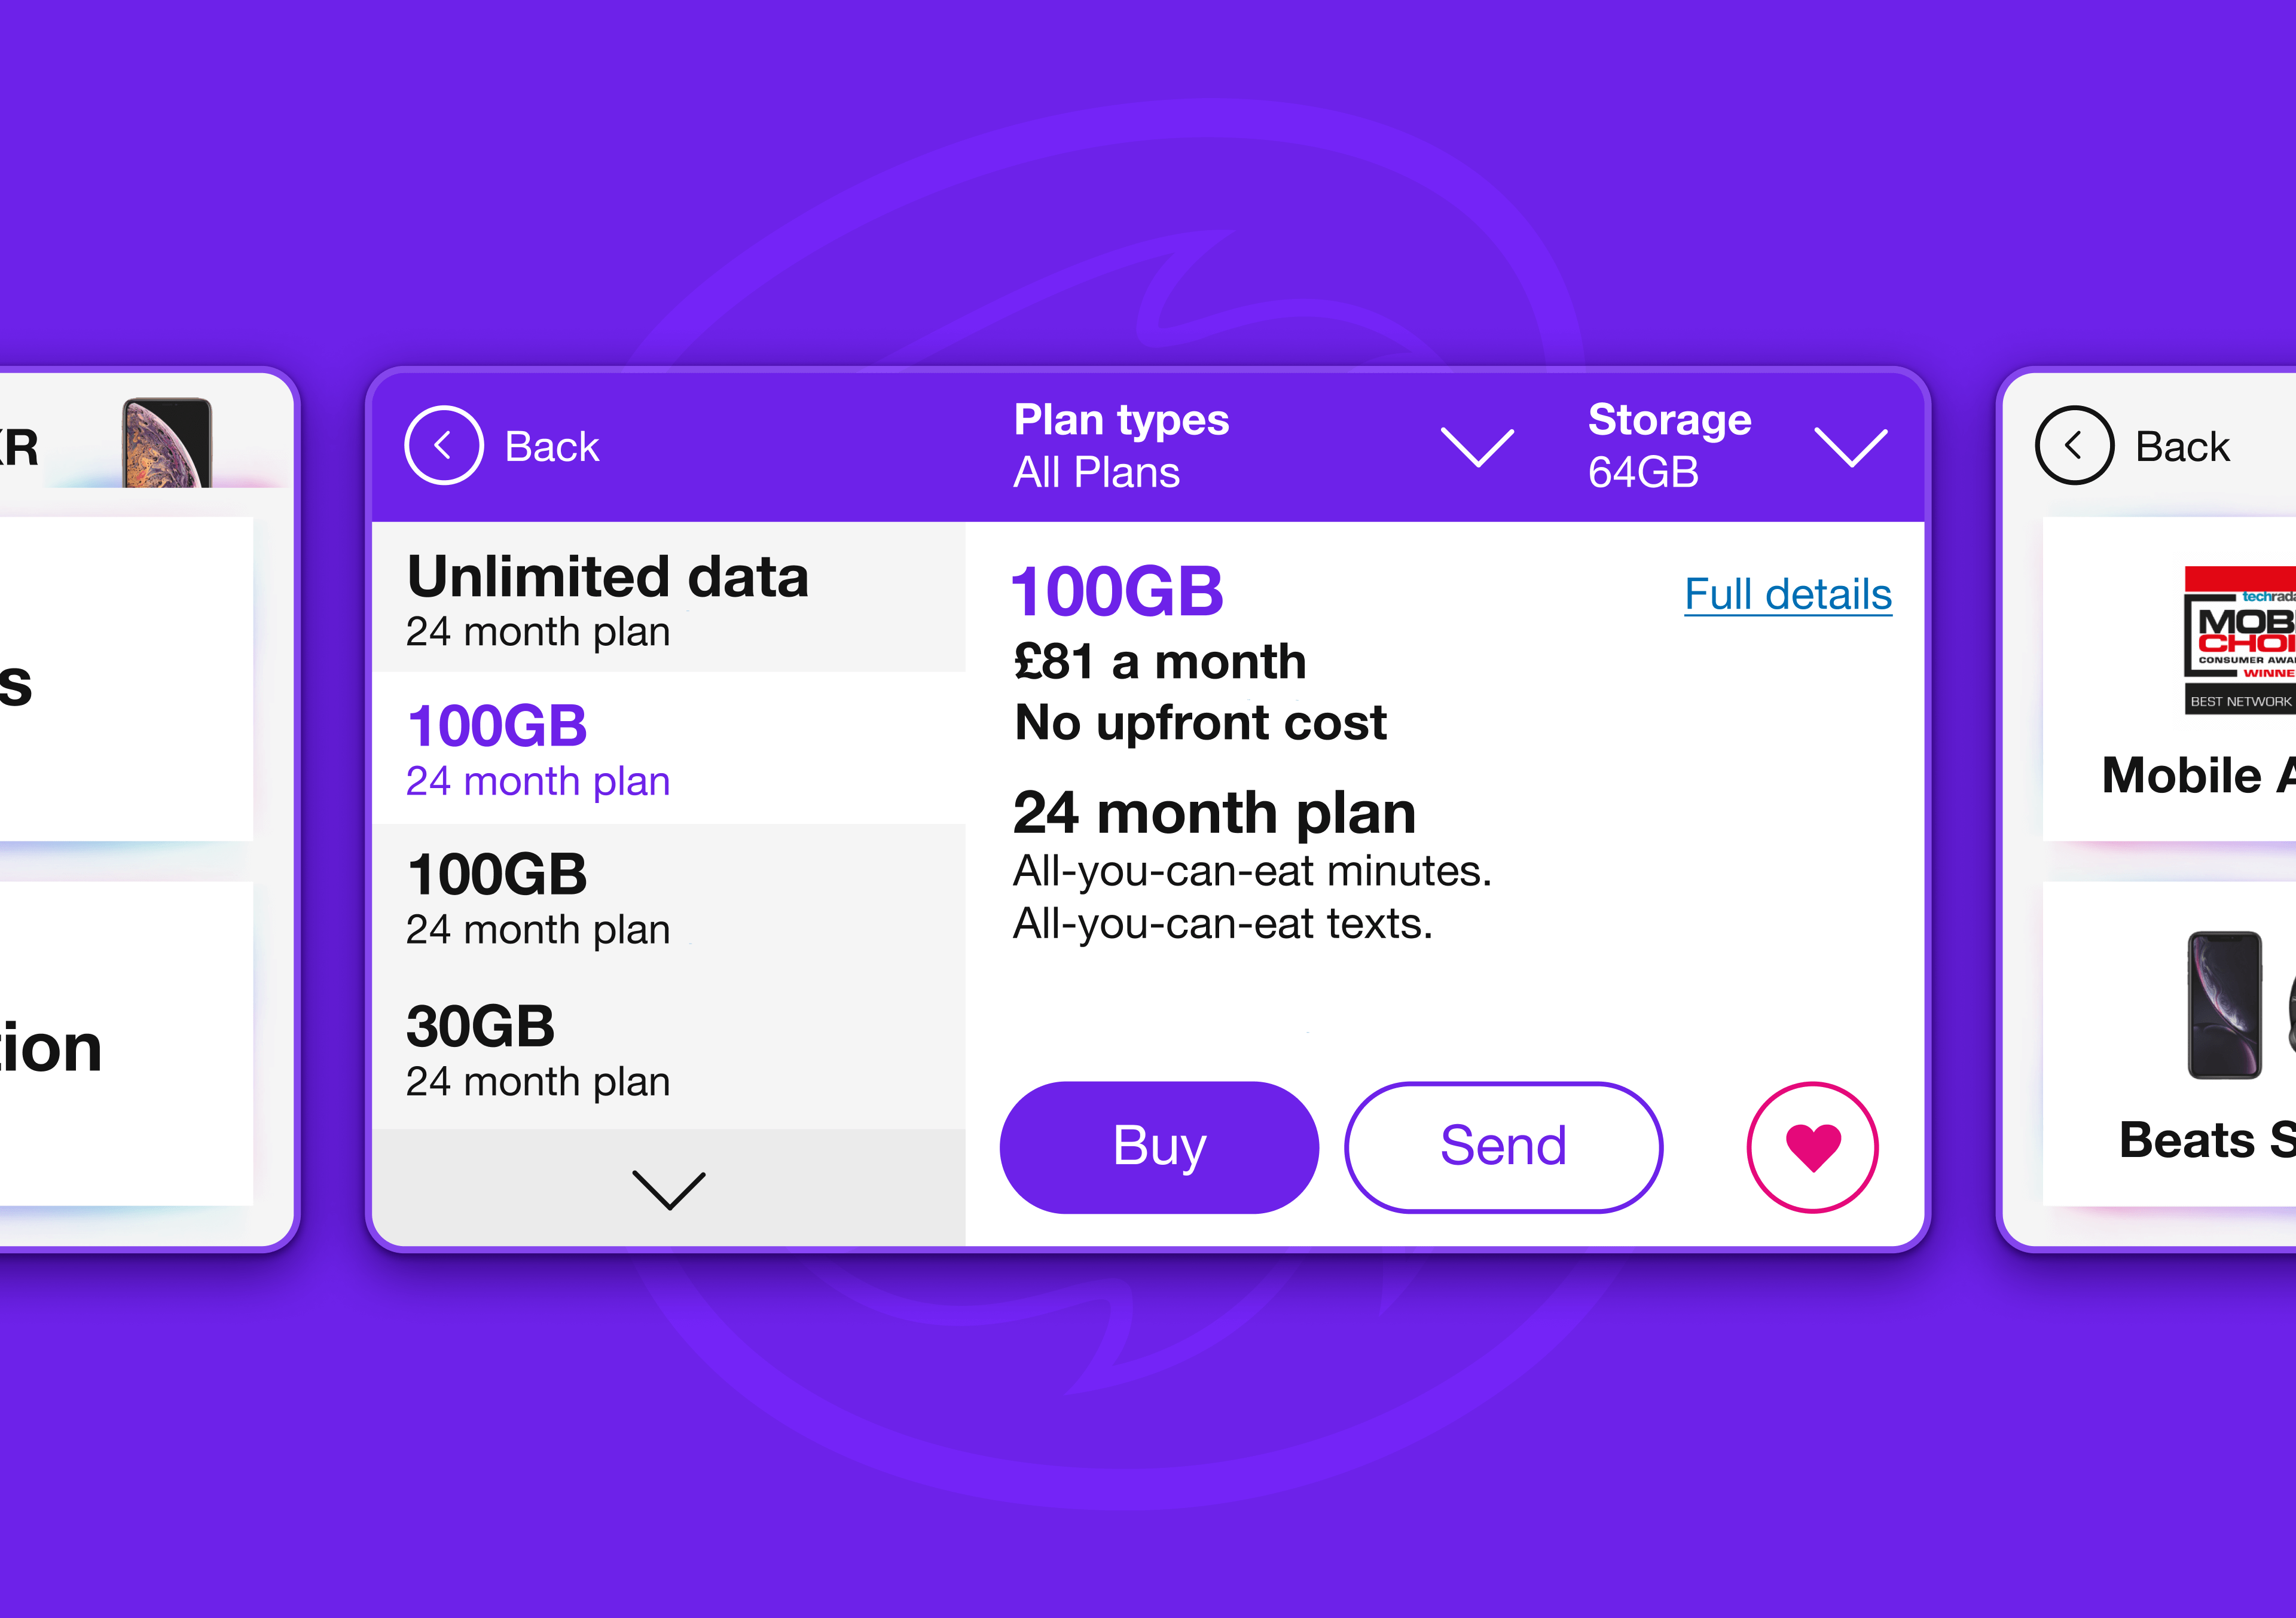
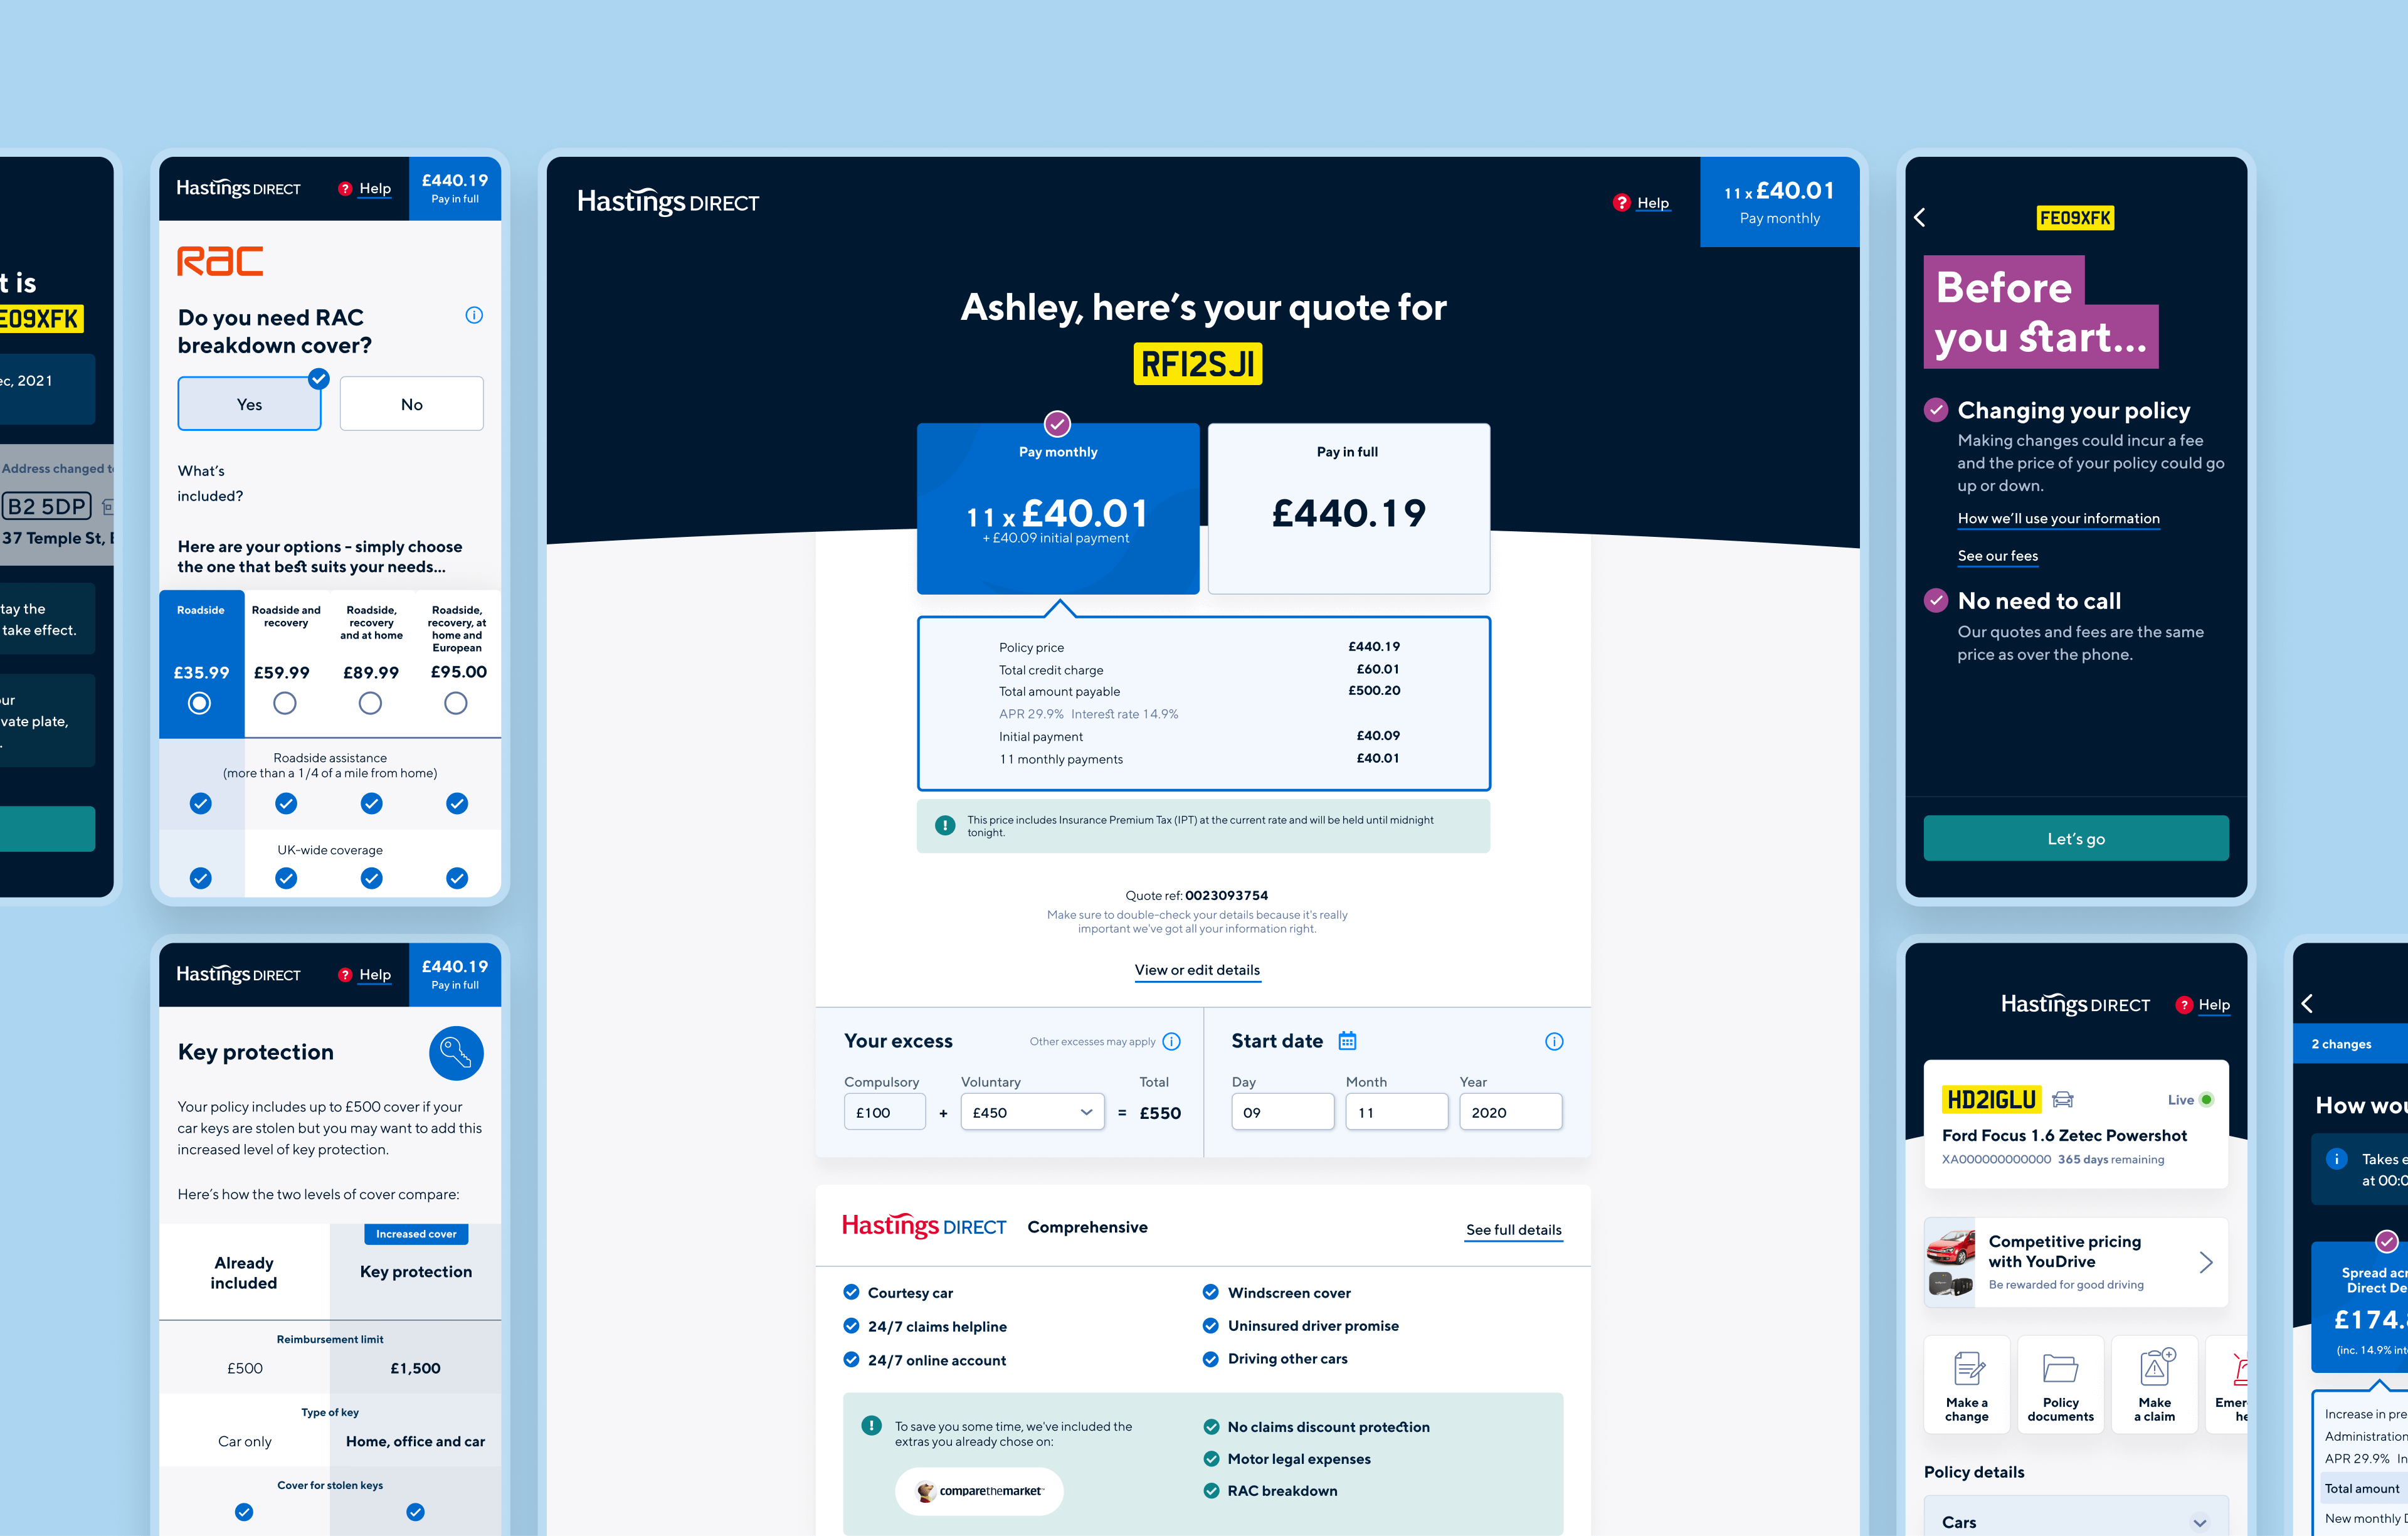
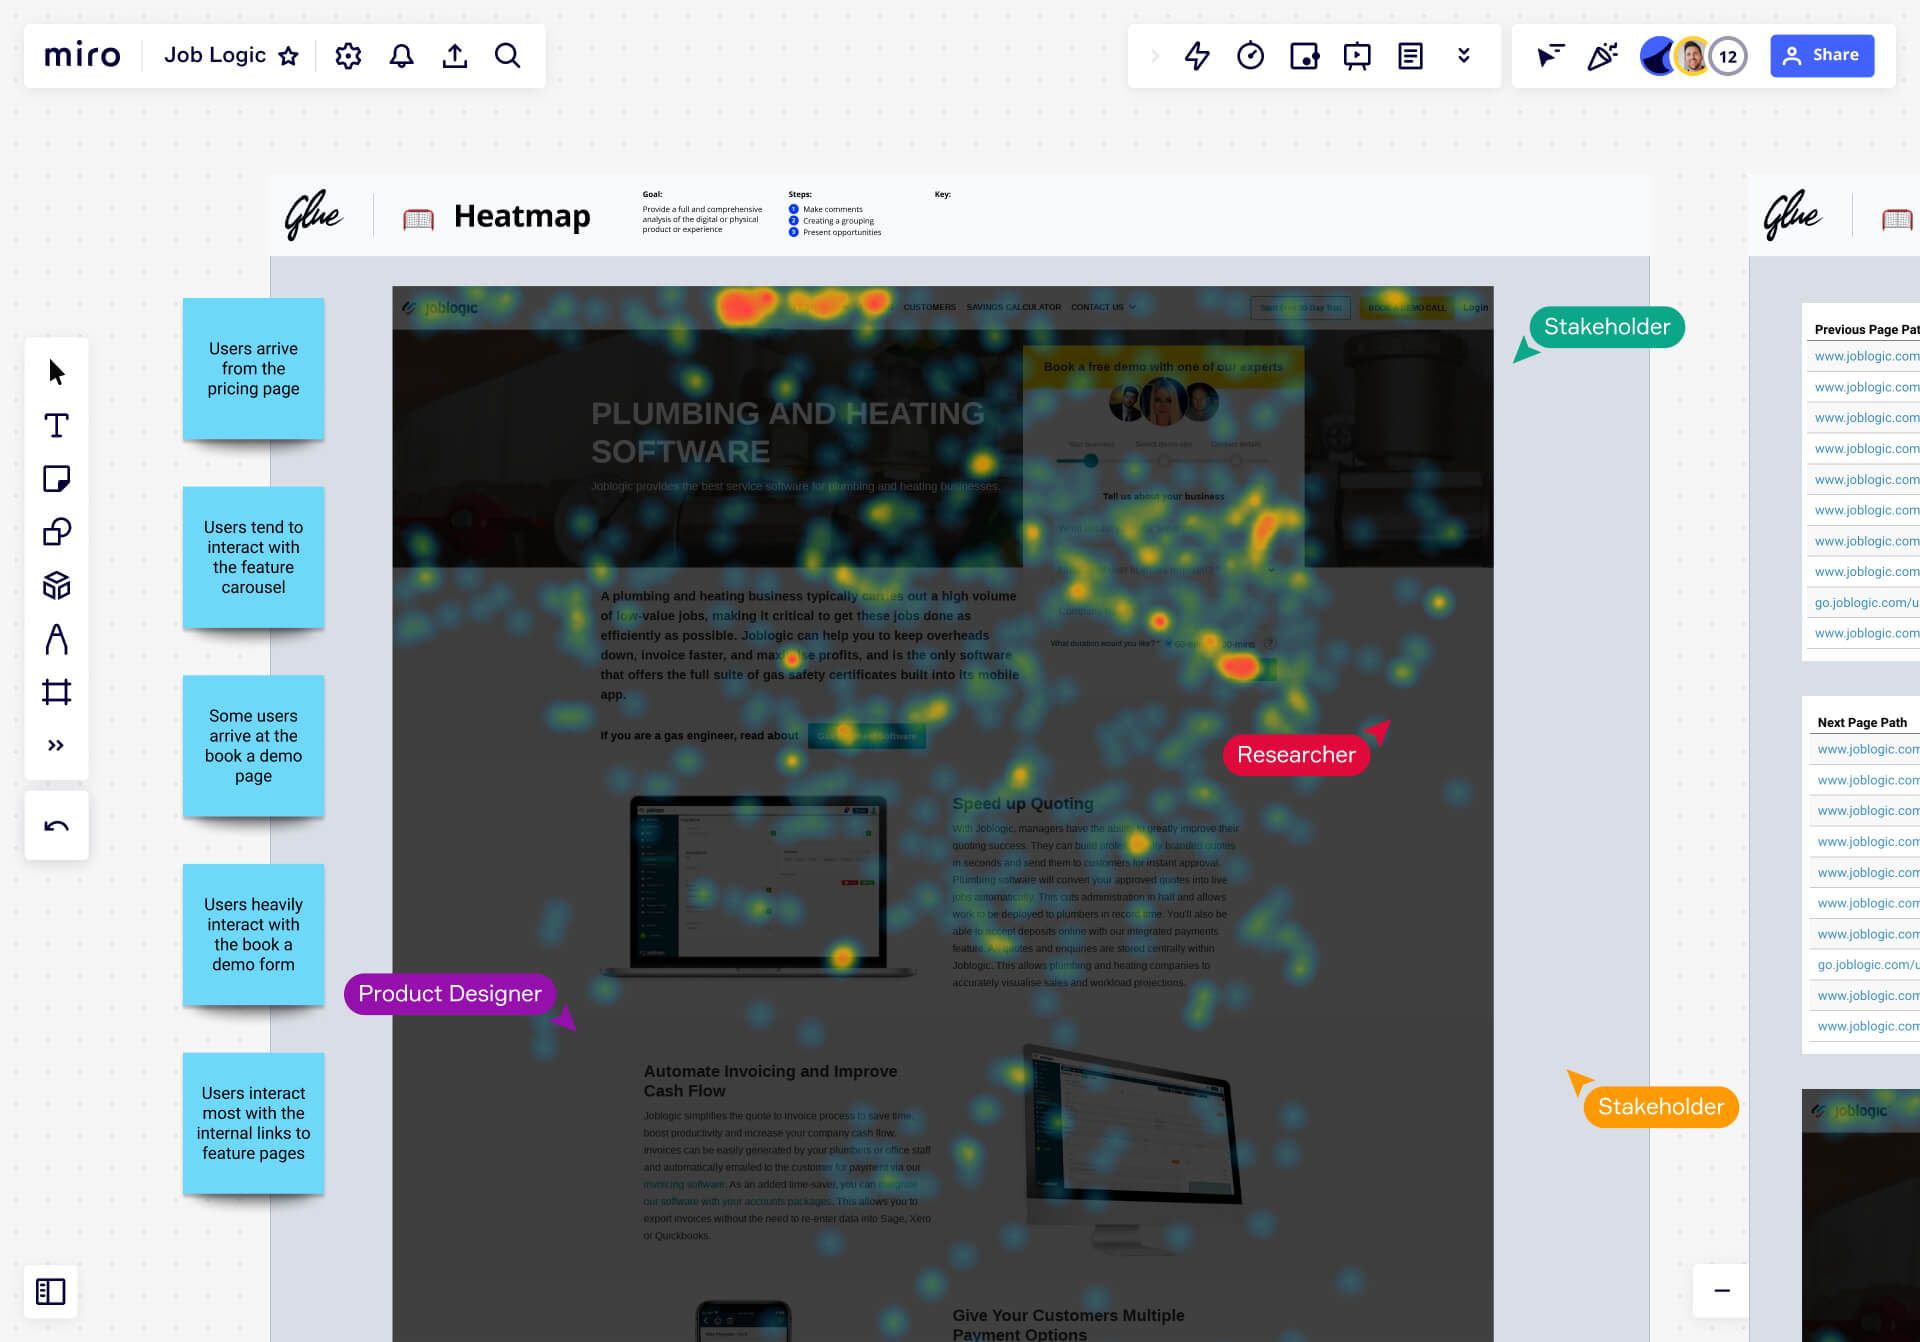
Three
Selling more phone tariffs through digital
- 11 experiments executed
- Conducted over 12 sprints
- Measurement period of 6 sprints
- 11 experiments executed
- Conducted over 12 sprints
- Measurement period of 6 sprints
- 11 experiments executed
- Conducted over 12 sprints
- Measurement period of 6 sprints
- 11 experiments executed
- Conducted over 12 sprints
- Measurement period of 6 sprints
Blinds2Go
Multi-site experiments for a category leader
- 12 core features tackled
- 186 pains points identified
- 52 user interviews conducted
- 12 core features tackled
- 186 pains points identified
- 52 user interviews conducted
- 12 core features tackled
- 186 pains points identified
- 52 user interviews conducted
- 12 core features tackled
- 186 pains points identified
- 52 user interviews conducted

Eque2
Elevating two core business management platform experiences